Huygens equity market stress indicator continues to maintain bullish positioning in strong bull market conditions

There are many ways in which the second quarter of 2017 was unusual for U.S equity markets, especially with regards to market volatility. 

Recall that the VIX index reflects a normalized price being paid by investors for protection against downside movements in the S&P 500 index.  Lower readings of the VIX imply relatively low demand by investors for this protection.  VIX closing levels below 10.0 have been exceedingly rare:  over a 27 year period  (January 1, 1990 through April 30, 2017) there were only ten days on which VIX closed below 10.0, the most recent being in January of 2007, well before the Global Financial Crisis erupted. 

Then, in May and June of 2017, the VIX index closed below 10.0 on seven additional trading days and averaged 10.69, the lowest 2-month average level in its 27-year history.   Equity market behavior has for now justified such low demand for protection:  The S&P 500’s peak-to-trough range (one measure of realized volatility) in the month of June was the narrowest it has been since the 1960s.

Source: Yardeni.com

Source: Yardeni.com

One possible explanation for such investor confidence toward U.S. equities is that the S&P 500 appears to have genuinely emerged from its earnings recession of 2015 and 2016.  The above chart shows that operating profit per share, and management expectations for earnings per share, declined significantly in 2015 & 16.  That trend has now reversed, and if the current profit cycle follows the pattern of past cycles, there is the potential for several more quarters of S&P 500 profit growth ahead.

Source: National Federation of Independent Business (NFIB)

Source: National Federation of Independent Business (NFIB)

The National Federation of Independent Business, a trade organization for small U.S. businesses, publishes the above small business optimism diffusion index.  It combines quantitative measures, such as changes in small business inventories and job openings, with responses to survey questions such as expectations for future revenue growth.  The index remains near the historically high levels it reached immediately after the presidential election, signaling a sustained level of economic optimism not present in U.S. small businesses for over a decade.

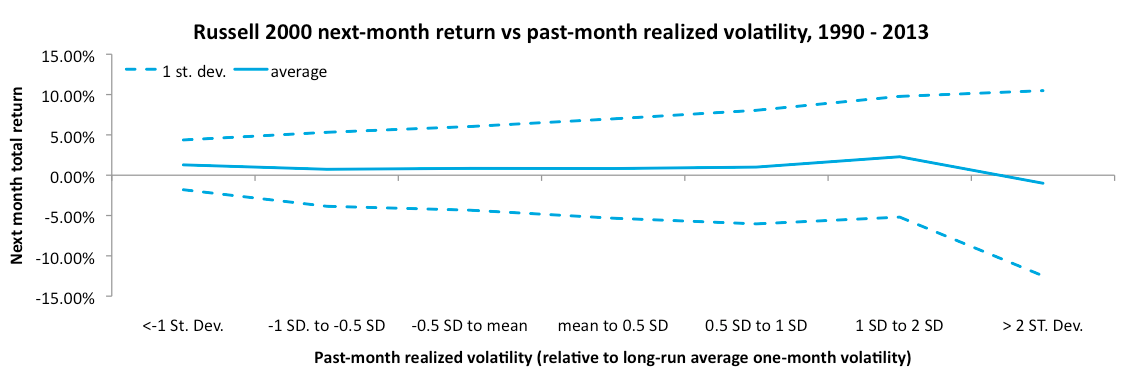
Such optimism, low equity volatility, and low fear of volatility, might be taken as a signal of investor complacency and an early-warning sign of a market top. A risk-averse investor might seek to take profits in such conditions. Our analyses of the historical VIX index and equity market data going back to 1990 have shown us that the best approach to such low volatility regimes is to maintain exposure to equities. Our indicator system has done just that in 2017, driving steady positive returns for our strategies and for our clients.

Huygens equity market stress indicator maintains bullish positioning amid accelerating earnings growth, protecting against behavioral response to alarming headlines

The first quarter of 2017 saw a steady stream of unsettling domestic and international news.  An investor observing this would have likely expected much worse equity market volatility than was experienced, and might have been tempted to entirely avoid exposure to the equity market.  However equity market volatility was at very low levels - the S&P 500 Index went 55 straight trading days without a 1% or greater move in either direction, and the VIX index averaged 11.7 in the quarter, the lowest first-quarter average on record going back to 1990.   Protection against the behavioral tendency to react to news flow is one of the main benefits our system is designed to provide.   Our signal remained in the ‘offense’ state throughout the quarter.

Source: NFIB

Source: NFIB

Despite all the disquieting headlines, equities are currently being supported by many positive factors: S&P 500 earnings are strongly growing again after declining for several straight quarters; the Federal Reserve is raising interest rates at a measured pace, comforting investors that no surprise moves are in store while simultaneously encouraging portfolio rebalancing away from bonds and into equities.  Perhaps one of the strongest factors supporting equities is sentiment.  The above chart from the NFIB, a trade association for small businesses, shows the recent dramatic rise in small business optimism, likely responding to the current administration’s aggressive pursuit of a pro-growth agenda.

A nervous investor could be forgiven for feeling pessimism, however.  The U.S. manufacturing sector continues to stagnate, with production volume remaining essentially flat for the past five years at a level equal to that first reached in 2004, and well below the peak level reached in 2007.

Source: Yardeni.com

Source: Yardeni.com

Meanwhile global debt as a percent of GDP has continued its rise and now exceeds levels seen in the depths of the financial crisis.

Source: International Monetary Fund

Source: International Monetary Fund

Perhaps most concerning is a recent steep decline in the growth rate of U.S. bank lending.  The causes for it are unclear, but its coincidence with the Federal Reserve’s positioning on interest rates in late 2016 is uncanny.  If the decline continues it signals the exact sort of credit market tightening that has contributed to past recessions.

Source: Wall Street Journal

Source: Wall Street Journal

While certain economic indicators are promising and business is feeling optimistic about growth prospects, not every indicator is positive and some are downright worrisome.  Our economy and equity markets have been particularly perplexing and difficult to analyze since the financial crisis, to say the least.  It is for confusing times like these that we developed our investment system.

Introducing our dynamic derivatives portfolios for high net worth and institutional clients

Our Titan and Sidereal strategies generate returns by tactically harvesting the equity Volatility Risk Premium (“VRP”).  The VRP, in simple terms, is a measure of the extra price investors are willing to pay for protection against equity market losses, as compared to the price a rational investor with perfect information would pay.   The difference is positive most of the time – in other words, investors are generally willing to overpay for insurance against losses.  Our system is designed to capture this premium only during times when the probability of an abnormal equity market drawdown is low.  If our system determines the likelihood of an equity drawdown is unacceptably high, we move our client assets to cash the next day and wait for our system to indicate that conditions have turned more favorable. 

To harvest the VRP, both strategies will hold a short position in VIX futures contracts (or an ETF containing these contracts). These contracts are typically priced above the current (or "spot") level of the VIX index, with the difference reflecting, in part, the VRP.As time passes and the contracts approach maturity, their price must converge with the spot VIX index.If forecasted volatility does not appear, the futures contracts prices will fall to meet the spot level, and our clients will benefit.

VIX roll down chart.png

The above chart illustrates this process for the August 2016 futures contract.  As of July 20, 2016, the spot VIX Index was priced at 11.8 and the August 2016-expiry VIX Futures contract was priced at 15.5.  This price difference reflects, in part, the VRP investors were willing to pay for equity drawdown protection in the summer of 2016.  The chart shows the declining price of this contract each week, as equity market volatility failed to materialize.  Eventually on August 17, the contract matured at a price equal to the spot VIX index at the time.  Investors who shorted this futures contract on July 20 earned 2.7 points (from 15.5 to 12.8), or 17%, in the 21-day period from July 20 to August 17.

Of course, the performance of this approach will vary over time.  The summer 2016 data, while better than the average month, are not uncommon.  Bull and sideways equity markets generally present opportunities to harvest VRP, as do the recovery phases of bear markets.  Attempting to harvest VRP should be avoided during the onset of an equity correction or bear market.  The discernment of better or worse conditions for VRP harvesting is the core of Huygens’s tactical system that drives our strategies. 

We designed our system in 2016, after spending two years reviewing academic research and experimenting with live trades.  We studied 11 years of daily market data and examined our system’s hypothetical responses to it.  Over this time frame, in hypothetical tests our system recommended having exposure to the VRP-harvesting position 45% of trading days, and remaining in cash 55% of days.

Our Titan strategy is the purest expression of this approach; the Sidereal strategy combines it in a portfolio with a long position in 10-year treasuries, trading some potential absolute return for potentially more stable portfolio returns.

Huygens equity market stress indicator quickly returns to bullish positioning despite noise and confusion surrounding presidential election

The weeks since early November 2016 are emblematic of a period when a quantitative indicator of true stock market stress can be most helpful to protect investors from their psychological biases.  You may recall that many respectable economists predicted severe and immediate financial market panic if Donald Trump won.  

On election night, at roughly 2:30 AM when Fox News first called the election for Donald Trump, Walt received a call from a close friend (who is however not a Huygens client).  “Is there any way I can sell all my mutual funds before the market opens tomorrow?” he asked.  At the time of that phone call, U.S. equity index futures were dropping precipitously.   

The panic quickly subsided. Within a day of the election, our market stress indicator turned offensive and has stayed in that state ever since, and as a result our strategies have captured much of the ensuing strong equity market run. An individual’s natural response would have been to expect volatility to resume, and therefore to wait on the sidelines for a better market entry point. Our system recommended otherwise, to our clients’ benefit.

Earlier in 2016, we pointed out that equity market stress, as measured by rolling 12-month volatility of daily returns, has been continuing its long decline from the 2008-9 global financial crisis, despite having reached a recent minor peak in February of 2016.  The Kansas City Federal Reserve Bank’s index of financial market stress, which combines measures of stress in multiple financial markets including equity, debt, and foreign exchange markets, illustrates this well:

KC Fed stress index.png

Huygens market stress indicator correctly maintained bullish positioning in the quarter & captured stocks' gains, at a time when recession seemed imminent but never arrived.

Despite current jitters over the upcoming elections, the U.S. economy continues to improve, albeit slowly.  The Conference Board’s Leading and Coincident Economic Indicator Indices both signal that a downturn in economic activity has not yet arrived.

Source: The Conference Board

Source: The Conference Board

At the core of our strategies is a system for determining when to have offensive or defensive exposure to U.S. equities.  While there is certainly benefit to a system that can move to a defensive position before an equity market selloff has reached its bottom, it can be equally beneficial for that system to maintain an offensive positioning when emotions might otherwise lead a human investor to play it safe.  Thus our system has maintained its offensive positioning for all but four trading days this year, capturing the Russell 2000’s strong recovery since February.

In past client notes we have commented on our study of regimes in financial market behavior.  The below chart graphs rolling 12-month standard deviation of daily returns to illustrate long-term behavioral regimes in the U.S. large-cap equity market.  Volatility has been in a continued decline since the 2008-9 financial crisis.  Recent bursts of volatility in 2015 and early 2016 were driven mostly by fears of aggressive central bank tightening, not by true underlying economic weakness.  Now that the tightening has not materialized, volatility has resumed its long, slow decline.

S&P realized vol.png

As you know, the Huygens Market Stress Indicator system monitors equity market volatility daily in order to react to any sudden and severe changes in equity market sentiment. The general lack of change in our system’s positioning in 2016 seems consistent with the ongoing (if slow-moving) economic recovery, and the large-scale decline in equity market volatility.

Like you, we wait with some anxiety to see what early November brings.Regardless, we continue to monitor equity market stress daily and react accordingly.

Huygens market stress indicator correctly stayed bullish at quarter end as US Central Bank interest rate stimulus cushioned US stocks against Brexit volatility and ongoing earnings softness

The story of the quarter is straightforward.  In our previous two client notes, we noted the marked underperformance of the Russell 2000 small cap index relative to the S&P 500, but commented in our Q1 2016 note that the worst of this divergence was likely over.  We pointed out that it was driven by two factors: the Russell 2000’s overexposure to energy, and the S&P 500’s overexposure to corporate buybacks.  With oil prices recovering and stabilizing since February 2016, and with the volume of corporate buybacks declining in 2016, the Russell 2000 outperformed the S&P 500 by 6% off the early February bottom.  See the chart below.

Russell SPLV SP500 chart.png

In addition, the S&P large cap low-volatility index also outperformed the S&P 500.  This index tends to overweight high dividend-paying stocks.  At the start of 2016, the U.S. Federal Reserve Bank (FRB) had signaled it would likely increase interest rates 4 times in the year, but several indicators of economic growth, including inflation, job creation, and wage growth, were low enough to force the FRB to reconsider.  Its current messaging is that it may only raise interest rates once or twice, and as a result dividend-paying stocks have outperformed the broader index.

We finally also note the very brief burst of volatility surrounding the UK’s decision to leave the EU.  Our market stress indicator correctly remained offensive during the whole episode, and equity market performance quickly validated that call.

In sum, several things went our way this quarter.

Is a recession already underway? Decreasing total US market cap + flat large cap stock prices + falling small cap stock prices = corporate buybacks the main support for S&P 500 stocks

The nearly flat performance of U.S. equity indices and of our Pilot strategies in the first three months of 2016 belie the full story of the quarter.  The divergence between the Russell 2000 and the S&P 500, which we first mentioned in our Q4 2015 note, continued and accelerated.  The below chart shows the relative change in the equity indices our strategies use versus the S&P 500 over the past two years.  During most of this time, the Russell has lagged the S&P 500.  The lowest-volatility names of the S&P 500 - generally defensive stocks such as utilities and consumer staples - performed best. 

Russell SPLV SP500 chart.png

In mid-2015 it appeared the small-cap vs. large-cap performance gap was closing, but instead it widened further, with the Russell underperforming the S&P by 11.0% since June 29, 2015.  More than half of that gap occurred in the fraught first six weeks of 2016.  We believe the ongoing divergence has been driven by falling oil prices (disproportionately negative for small-caps), and corporate buybacks (disproportionately positive for large caps).

Source: Yardeni.com

Source: Yardeni.com

The above and following charts, from Yardeni Research, show that energy is having more impact on the small-cap universe than the large-cap.  The S&P 600 is a U.S. small-cap index, essentially comprising the 600 largest companies of the Russell 2000 index that we use.  The charts show the relative expected earnings contribution of each industry segment to the earnings of the overall index.  At the start of 2014, energy was by far the largest contributor to small cap expected earnings, but in 2015 that contribution declined dramatically and turned negative.  Energy earnings expectations briefly improved in mid-2015, but then deteriorated further into negative territory through Q1 2016. 

Source: Yardeni.com

Source: Yardeni.com

Energy was also a drag on the S&P 500 large-cap index over this time, however its relative contribution to index earnings wasn’t as large to begin with in 2014, plus large-cap energy companies have managed to keep their earnings positive.

Now consider the Thomson-Reuters U.S. equity mutual fund flow data below. It shows that aside from 2013-14, investor capital has been steadily flowing out of U.S. equities, with the outflow accelerating to an annualized rate of $66B in Q1 2016.

Equity fund flows.png

Consider also that, according to the World Bank, U.S. equity market capitalization shrank by 4.8% in 2015, from $26.3 trillion to $25.1.  Corporate buybacks, a mainly large-cap phenomenon, help explain what has been supporting the S&P 500 index as market capitalization declined and investor capital flowed out of the market.  According to the below Factset Research chart of trailing-twelve-month U.S. buybacks, the annual value of corporate share buybacks has remained near its pre-financial crisis peak, even as earnings have declined.  These buybacks simultaneously put upward pressure on equity prices, and return capital to shareholders reducing market capitalization. 

Source: FactSet

Source: FactSet

Projecting these two trends forward, it appears that the worst of the large-cap / small-cap divergence may be over.  If S&P 500 earnings don’t rebound from their ongoing decline (light green bars in the above chart), companies may choose to deploy more of their net income into growth projects rather than return it to shareholders through buybacks.  Regarding energy, WTI crude oil prices have recently risen 43% since February to $45.92 / bbl, a level not seen since December.

This may not mean that the economy has turned a corner.In fact, the below Yardeni Research chart shows that when S&P 500 revenues have declined for multiple quarters as they have recently, a recession was already underway. Stay tuned.

Source: Yardeni.com

Source: Yardeni.com

Risks increasing and rewards decreasing in post-monetary stimulus environment

Our strategies’ performance in 2015 was driven primarily by three factors:

  • Rapid sentiment changes and reversals driven by Federal Reserve interest rate decisions

  • Outperformance of the S&P low volatility index relative to the S&P 500

  • Underperformance of the Russell 2000 small cap index relative to the S&P 500

R2K SPLV SP500.png

Huygens’s strategies are all designed to participate in the economic growth experienced by smaller U.S. companies (via the Russell 2000 small cap equity index) while giving some protection against economic downturns.  Our system is designed to minimize trading by riding out smaller index drawdowns, and switching to defensive positioning when conditions are more consistent with a severe decline.  Our Pilot and Mariner strategies trade some of the potential absolute gain of our tactical Russell 2000 exposure for cushion against smaller Russell drawdowns.  This cushion is provided by adding to the portfolio the defensive large-cap equity exposure of the S&P low volatility index (SPLV).

While both indices are highly correlated with the broader U.S. equity market, their smaller cycles tend to be negatively correlated.  The above chart of 2015 U.S. equity index performance shows that in the first half of 2015, the Russell 2000 was the best performing of the three indices, presumably because investor expectations for growth remained high.  In the second half of the year, investor sentiment deteriorated and the defensive SPLV index outperformed the Russell 2000.  The two indices worked together as intended to cushion each others’ fluctuations in our Pilot and Mariner client accounts.  However because the strategies have more Russell exposure than SPLV, the Russell dragged the overall portfolios down relative to the S&P 500.  Our Navigator clients have only the tactical Russell exposure, so its impact was more pronounced for them.

The August / September volatility event, which we discussed in more detail in our 3rd quarter 2015 client note, also contributed to our underperformance relative to the S&P 500. The central bank stimulus of the 2012-2015 period created an investor sentiment environment that depended almost entirely on Federal Reserve Bank actions and commentary rather than on fundamental performance of the overall economy. The volatility event’s rapid onset and equally rapid departure were both driven by expected and actual central bank activity here and abroad. Market reactions to these were quicker than our system is designed to respond to or protect against. The result was that, during this event, our system delivered the protection against volatility and further declines that it is designed to provide, yet it gave up performance relative to the S&P 500 on the first day of the event and the last due to the rapid sentiment changes and large market moves on those days.

Outlook for 2016

2016 is the first year since 2008 in which there is not some form of emergency Federal Reserve economic stimulus (either zero-interest rate policy or quantitative easing) in place at the beginning of the year. We designed our system around the assumption of independent market participants each making their best effort at rational price discovery, and we are hopeful for a return to this process in 2016. What might this mean for equity market performance? We find the following simple analysis enlightening.

Modified Sharpe.png

The modified Sharpe Ratio measures the average return an investor earns per unit of volatility experienced over time.   This chart shows that in the post-crisis era, the absence of central bank stimulus resulted in less return per unit of volatility than stocks’ pre-crisis long-term average.  In other words, without stimulus, risk increased and reward decreased.  We believe this will continue in 2016 as more of the stimulus-era gains are given up while fundamentals-driven price discovery continues.

Declining S&P revenues and profits driving equity market stress

The primary story of the third quarter was the August / September volatility event, which coincided with a period of global economic weakness and uncertainty.  The below chart from Yardeni Research illustrates the challenge faced by the U.S. economy, and therefore the U.S. equity market, in 2015.  The OECD index of U.S. leading economic indicators (the blue line) has been predicting a slowdown for most of 2015.  At the same time, S&P 500 revenues per share (the red line) have declined in 2015 from their year-ago levels and are on track to do so again in the third quarter, according to Factset Research’s most recent Earnings Insight report.

Source: Yardeni.com

Source: Yardeni.com

In late August, these factors plus a host of others – concern over a potential Federal Reserve interest rate increase, a stock market selloff in China and the Chinese government’s resulting surprise currency devaluation, persistent declines in commodity prices – all contributed to a burst of volatility in U.S. equities. 

The chart below shows that our Market Stress Indicator switched to Defense at market close Friday August 21.At the time, the S&P 500 was in the throes of its steepest decline since August 2011. In fact at market open August 24th, when our portfolios repositioned, equity indices were already down substantially from Friday’s close. Our Indicator remained in the Defense state for 30 trading days, the longest such period since we introduced our system four years ago. This period represented a classic investor sentiment regime shift from one of optimism to a regime of pessimism and fear, characterized by much higher than average daily volatility and abrupt reversals in equity market direction.

Signal vs S&P 500.png

During this 30-day period, the S&P 500’s daily volatility more than doubled to 1.83%, from 0.75% in 2015 through August 20th.  Over the past ten years, this level of volatility has only been seen during the market selloff of 2008-9, and the steep S&P 500 corrections of 2010 and 2011. 

Market downside volatility abruptly ceased on October 2nd, protecting the S&P 500 from further declines past its 12.4% peak-to-trough decline reached at the start of the volatility event in August.  The catalyst was most likely that morning’s disappointing Non-Farm Payrolls (NFP) report, which convinced investors that the Federal Reserve was unlikely to raise interest rates before its December meeting. 

In our view, this last point illustrates the U.S. equity market’s ongoing dependency on stimulus measures, and the risk of further volatility once these measures are unwound.  The October 2nd NFP report was disappointing in several areas: job creation was shown to be slowing, hourly wages declined, and average hours worked declined.  Such a report would normally depress equities due to its implications for future economic growth.  However, by making it difficult for the Federal Reserve to justify raising rates, in this instance it quieted volatility and ignited a recovery in U.S. equities that has continued through October, a continuation of the “bad-news-is-good-news” equity cycle induced by ongoing stimulus.

At the end of the third quarter of 2015, the Russell 2000 stood at 1100.69, a level it first reached nearly two years before, on October 17th 2013.Sideways trading in U.S. equities continues, without a meaningful break one way or the other.We wait along with you for the return of a trend.

Huygens system particularly relevant in confusing rare environment of narrow trading range, low volatility, few up days, and declining company revenues and profits

During the second quarter of 2015, our market stress indicator remained consistently in the offensive portfolio state.  All U.S. equity indices traded within a historically narrow range and ended the quarter essentially flat.  In fact, the narrow S&P 500 range in the first six months of 2015 placed the period in the lowest decile of all 6-month periods ranked by trading range going back to 1953.  Such a narrow range is rare, but not predictive of future returns.  In the middle 1990s the S&P 500 broke out of its narrow range to resume the strong bull market trend of that decade, but in 2007 the range breakout occurred to the downside with the global financial crisis.  What is clear is that periods of such low volatility are anomalous and not representative of the normal state of the equity market.

S&P 500 past 6 month trading range.png

The first half of 2015 was also notable when ranked on the basis of percent up days.  The chart below shows the S&P 500 returns in all six-month periods since 1953, grouped into deciles on the basis of the portion of days in the period with positive S&P 500 returns.  The relationship shown makes intuitive sense: those periods with fewer positive S&P 500 days are more likely to have had worse total return than those with more positive return days. The January to June 2015 period is notable because, on the basis of percent up days, it ranked in the second worst decile (marked in purple).

S&P 500 past 6 mo return.png

Nearly every period in that decile going back to 1953 had a negative S&P 500 return, and the median return in that decile is -4.7%.   The first half of 2015 was one of the very few 6-month periods of the past 60 years having such a low percentage of up days, and still delivering a positive return for the S&P 500: +0.20%.   

By any measure, the S&P 500 and other U.S. equity indices continue to trade within a remarkably tight range.  It remains to be seen which direction equities will break when the trading range normalizes.  Our indicator system monitors equity market stress on a daily basis, and when economic indicators are uncertain, as they are now, the downside protection it affords can be especially valuable.

As of this writing, the second quarter earnings season is in full swing.  Factset’s July 24th Earnings Insight predicts that when all S&P 500 companies have reported for the April to June quarter, the results will show blended revenue and earnings declines of 4.0% and 2.2% respectively, relative to the second quarter of 2014.  Given such performance, the stable condition of equity markets remains surprising.  In the past two quarters, revenue and earnings declines were limited to the energy sector.  However in the second quarter, according to Factset’s predictions, utilities and materials also experienced revenue and earnings declines.  Furthermore, blended S&P 500 revenues are expected to continue declining through the end of 2015.

As you know, we monitor market and economic circumstances regularly to confirm that our products are performing as designed. We believe it’s when economic indicators are uncertain, as they are now, that the downside protection afforded by our approach can be especially valuable.

US company earnings declining amid deflationary environment in many developed economies around the world

After many months of trending steadily higher from late 2012 through year-end 2014, U.S. equities have generally entered a quiescent state.  In our previous note, we pointed out that the small-cap Russell 2000 had been within a narrow range since Q4 of 2013.  As the S&P’s Q1 2015 return indicates, the large cap index has now entered a similar range.

Although the equity indices lacked any clear direction, the S&P 500 has experienced significantly more day-to-day fluctuation in the past two quarters than in the eight quarters that preceded them.The chart below demonstrates that the index’s recent increase in realized volatility to more typical historical levels is consistent with the end of U.S. quantitative easing.

Vol trend chart.png

Recall that our strategies are designed to use implied volatility, not realized, as a measure of institutional investor sentiment and therefore as a proxy for potential large imbalances in supply and demand for equities.  We consider S&P 500 put option implied volatility to indicate a normalized price that institutional investors are willing to pay for downside protection.  Despite the increase in realized volatility during the quarter, implied volatility remained predominantly at below average levels, consistent with bullish institutional investor sentiment.  As such, aside from four days early in the quarter, our strategies maintained an offensive positioning toward U.S. equities.  

Given the negative S&P 500 company Q1 guidance, analyst projections, and actual performance, we were surprised by the generally static condition of the S&P 500 index.According to Factset’s April 24th Earnings Insight, Q1 2015 S&P 500 revenues declined 3.5% from the same period a year ago, and aggregate earnings have declined 2.8% (based on the 40% of companies that have reported).If the remaining companies’ Q1 reports are consistent with this trend, Q1 2015 will be the worst quarter for the S&P 500 since the third quarter of 2009.Furthermore, the report indicates that consensus analyst estimates show revenues and earnings continuing to decline on a year-over-year basis through at least Q3 2015. There are several possible reasons to explain why the index hasn’t fallen:

  • Investors could be pricing the S&P 500 based on their performance expectations for 2016 and beyond.

  • Earnings per share have continued to increase, despite falling aggregate earnings, thanks to companies’ ongoing share buybacks.

  • Investors believe that as long as the Federal Reserve remains accommodative, it is unwise to bet against equities.

Perhaps each of these factors, among others, is important.  They all depend to some degree on a continuation of the Federal Reserve’s current accommodation.   In this context, it is important to note that broad inflation continues to be absent from the U.S. economy, despite nearly full employment and a burgeoning rebound in oil prices.   In fact, Institutional Investor recently ran a short piece titled, “Deflationary forces are gaining strength around the world.”  It demonstrated that since 2012, many developed economies around the world have been experiencing outright deflation, and many more are experiencing inflation rates below 1%.

Our conclusion is that, with U.S. company revenues and earnings likely to fall through the remainder of 2015, plus persistent general deflationary forces around the globe, we believe it is unlikely that there will be any meaningful change to the current interest rate environment this year.  It remains to be seen whether bullish U.S. equity sentiment will persist.  We continue to monitor equity markets daily, as we endeavor to position our clients to benefit should a downturn arrive.

After wind-down of US Central Bank monetary stimulus, equity market facing substantial headwinds in 2015

Outlook for 2015

Our investment strategies benefit most when the Russell 2000 experiences a wide trading range over the course of several months. Our focus here is to assess the potential for an increased Russell 2000 trading range in 2015, rather than discussing conventional macroeconomic topics or their potential impact on equity valuations. 

Factors we think could minimize the Russell’s trading range in 2015:

  • European quantitative easing:  For several reasons, we think the European QE program is likely to have less positive impact on U.S. equities than the U.S. program had.  However, by injecting large amounts of capital into global asset markets, we think it reduces the likelihood of a sharp selloff in U.S. equities in 2015.

  • U.S. interest rates:  Maintaining the consumer inflation rate at 2% per year is half of the Federal Reserve’s dual mandate (the other half being the maintenance of maximum employment).  Inflation has remained subdued globally, and the collapse in oil prices in the second half of 2014 has caused U.S. consumer inflation to stop rising and hold at a level below the FRB’s 2% target.  This might cause the FRB to delay raising interest rates, and by removing a potential source of downward pressure on earnings multiples, this could also reduce the likelihood of a sharp selloff in U.S. equities

  • The decline in the “oil tax”:  According to an analysis by UBS, each $10 decline in the price of oil contributes 0.1% to U.S. GDP.  Oil’s $60 decline since June of 2014 implies a 0.6% contribution to GDP, which may not be sufficient to power strong growth by itself, but which can help counter other potential economic headwinds.

Factors we think could maximize the Russell’s trading range in 2015:

  • Stretched equity market valuations: Here we refer to an analysis by James Paulsen, chief investment strategist of the Wells Capital Management subsidiary of Wells Fargo.The S&P 500 currently trades at 18 times trailing 12 months earnings, which is in the 74th percentile of multiples in the post-WWII era.High but not outrageously high, historically speaking.However, the median price-to-earnings ratio and price-to-cash-flow ratios of all NYSE stocks are currently at record levels.The implication is that, on average, the broad U.S. equity market is more expensive now than it ever has been, leaving little margin for error should a hiccup occur in earnings growth.We also note Jeffrey Gundlach’s observation that since 1871, U.S. equities have never risen seven consecutive years.

Source: Wells Capital Management

Source: Wells Capital Management

  • Credit market stress:  Below, we have updated a chart we included in last quarter’s note.  In late 2012, high yield and government fixed income instrument valuations diverged, in anticipation of U.S. economic growth resulting from QE3.  In 2013, the instruments moved in unison as interest rate expectations changed.  Beginning June 2014, high yield has underperformed government debt, partly due to the end of QE, but also perhaps indicative of concerns about credit quality among corporate borrowers.  This has been attributed mainly to highly leveraged “fracking” oil producers, who borrowed heavily from mid-western regional banks to expand production.  As oil prices have fallen since mid-2014, these producers have struggled to remain solvent.  While this is a typical credit cycle that could remain contained within the oil sector, it is possible that regional bank balance sheets will be sufficiently damaged to result in reduced credit availability in other industries.

HYG vs IEF.png
  • China slowdown contagion:  According to a recent Fortune Magazine analysis, real estate accounts for 25-30% of China GDP, when the entire construction value chain is considered (including upstream raw materials and downstream furnishings).  More than 60 million vacant apartments currently sit unsold throughout China, and housing prices nationally declined 4.5% in 2014.  Chinese construction has been the primary driver of global commodity markets in recent years, and the current slowdown has been coincident with the decline in many hard commodities.  We believe this slowdown will continue, and will cause rising credit stress in those economies dominated by commodities production.  Declining foreign trade can then spread this stress to developed markets.

“Ghost city” of unsold apartments in Yingkou, China (Wall Street Journal, 14 Apr 2014)

“Ghost city” of unsold apartments in Yingkou, China (Wall Street Journal, 14 Apr 2014)

In sum, in 2015 the global economy is already facing more stresses than it did in 2014.  Although ongoing central bank activity has the potential to cushion the equity market swings that may result, we think we are unlikely to see another trend-free year for the Russell 2000.

Wind-down of US Central Bank monetary stimulus inducing market volatility and suppressing returns; Huygens introduces tactical asset allocation strategies

The ongoing theme of this year continues to be the increase in U.S. equity market volatility in response to the termination of quantitative easing, and the open question as to how financial markets will react longer term following the end of QE.  Throughout most of the program, which began in mid-November 2012, risk assets outperformed defensive ones.  The first two charts below show the Russell 2000 outperforming the S&P Low Volatility Index (an index comprised of 100 defensive components of the S&P 500), and high yield bonds outperforming 10-year treasuries, through February of 2014.

R2K & HY vs VIX over time.png

Beginning in March of 2014 (vertical line 1), these performance gaps began to close, four months after the Federal Reserve commenced the program’s taper.  Then in July of 2014 (vertical line 2), high yield bonds and small cap stocks began to sell off precipitously, while the CBOE VIX index rose.  This process continued through the end of the third quarter.  Although the VIX rose substantially in the third quarter relative to its July 3rd low of 10.32, in absolute terms it remained below its long-run average, which is consistent with a risk-on regime.

Our assessment is that this underperformance by the Russell 2000 relative to large cap indices, during a period of continued risk-on sentiment, is a reversal of the phenomenon witnessed at the beginning of QE.  Just as large amounts of liquidity being injected into financial markets benefited risk assets more than defensive ones, the decline in this liquidity as QE has been tapered is having the reverse effect.  Our strategies gain their equity exposure primarily via the Russell 2000 ETF (IWM) and the S&P Low Volatility ETF (SPLV), so a period such as this will cause our strategies to underperform the broader indices.  This pattern of risk assets underperforming defensive ones can be an early sign of a change in equity market sentiment.  It is also the main reason our strategies typically have their worst relative performance in the later stages of bull markets.  

Outlook

QE has continued for nearly two years, and if the Federal Reserve stays on course the program will be terminated at the next FOMC meeting on Oct 29th.  The distortions it has caused across many financial markets have been widely reported.  The program was experimental, and its merits and drawbacks will likely be debated for years.  Our view is simply that the moment has finally arrived when normal market forces will return to their role as the primary drivers of financial markets, for better or worse.  We have said before that this transition is likely to feel somewhat rocky.  In fact, the four weeks ending Oct 15th saw the S&P 500 undergo a 7.4% drawdown, its steepest since QE began.  By comparison, between March of 2003 and December of 2006, a period of relatively low volatility and dramatic growth for U.S. equities in which the S&P 500 rose 64.7%, there were three such 7%+ drawdowns. 

European economic growth has not recovered at the same rate as that in the U.S.  Eurozone unemployment remained at 11.5% as of September, near its peak of 12.2% during the financial crisis, and retail sales there have been declining, particularly in Germany.  Several analysts have attributed the early October U.S. equity market volatility to concerns about Eurozone growth, because large cap U.S. companies generate significant earnings overseas.  To encourage higher growth rates and inflation, the European Central Bank introduced negative interest rates and has begun a new quantitative easing program of its own. Due to the process of arbitrage across asset classes and geographies, this QE program is likely to have some positive impact on U.S. equities, despite its likely smaller size than that of the U.S.  Note that the S&P’s recent bottom occurred within days of the ECB’s announcement that it had commenced buying asset-backed bonds. 

Huygens Business Update

Some of you may be aware of a new segment of the asset management industry known as ‘liquid alternatives.’  These are hedge fund-like strategies distributed either in a mutual fund structure, or via financial advisors using separately managed accounts.  The liquid alternatives segment has been the fastest-growing market segment in all of asset management since 2011.  Retail investors were the early adopters of these strategies, however more recently institutional usage has risen significantly.

These products are generally tactical and systematic in design, and because of the way they are distributed, they offer their clients daily liquidity.  Our approach of systematically trading highly liquid index ETFs lends itself well to this market.  Our long-term vision for our firm has always been to offer a suite of complementary investment products, all differentiated by our proprietary system for identifying regime changes in U.S. equity market risk appetite.  As a result, we have developed and introduced the Pilot line of products for the liquid alternatives market. 

Our Pilot products are tactical asset allocation strategies, rotating among U.S. equities and 10-year treasuries ETFs in response to the same Navigator indicator that drives our current strategies. In September of this year we completed our registration as an investment advisor in New York, which was a necessary step for the growth of our business generally, but was particularly necessary for the launch of our Pilot products.We would be happy to discuss these products, or anything else in this letter, with you more at your convenience.


US Central Bank becoming uneasy with distortions caused by ongoing monetary stimulus

In our last quarterly note, we shared an analysis demonstrating that the Russell 2000’s increased volatility in the first three months of the year, while unsettling, was not yet predictive of further declines.  At the time, our Navigator system was indicating that the bullish regime in US equities remained in place.  In the second quarter, despite similar ongoing volatility, the Russell went on to recover all of its losses and closed the first half with a year-to-date gain.   At the end of the second quarter, our system continued to indicate bullish sentiment in the US equity market. 

Outlook

One year ago, in our July 2013 client note, we expressed a point of view that was rarely heard at the time, but which has since become widely accepted – that the Federal Reserve’s current monetary stimulus program supports equity prices and reduces financial asset volatility in a way that interferes with normally functioning markets.  In our October 2013 client note, we pointed out that US equities experienced significant volatility and drawdowns within weeks of termination of the past two QE programs.  The minutes of the Federal Reserve’s June 2014 Open Market Committee meeting indicated that the coming three months will be the final full quarter of the program, barring any unforeseen circumstance.  Unlike with the past two programs, this termination has been very carefully orchestrated and communicated, and the US economy appears to be on a better footing.  As of now, our Navigator system is not indicating increased equity market stress in anticipation of this event.  However the second half of 2014, and particularly the fourth quarter, will likely bring a further increase in equity market volatility as investors’ faith in the economy’s ability to support itself is tested. 

As has been true in the past several quarters, the US economy is giving mixed signals on which to judge this ability.  There are certainly many positive signs:  The unemployment rate has fallen steadily in 2014, with May’s rate of job creation the highest since the financial crisis began in 2008.  The ISM’s manufacturing and non-manufacturing PMI indicators have risen steadily in 2014 and are at levels consistent with growth.  The ratio of negative to positive pre-announcements by publicly traded companies has fallen from its all-time high - recorded late last year - back into a range more typical of a growing economy.  Perhaps most significantly, the $2.7 trillion of excess reserves accumulated by banks as they sold fixed income instruments to the Federal Reserve during quantitative easing is now finding its way back into the economy at an accelerated pace in the form of increased lending (see figure below). 

Fed assets chart.png

To date, this money has been sitting on bank balance sheets earning a paltry 0.25% annual return.  Although these excess reserves are technically an increase to the nation’s money supply, because they were not moving through the economy, they were not stimulative at all, and instead drove the money multiplier to the lowest level in over fifty years.  As this money is loaned out, it should increase the money multiplier and have a dramatic effect on money supply, GDP, and possibly, inflation.

But there are also signs that the economy may still be fragile, and perhaps not able to sustain growth without the Federal Reserve’s help.  The following chart of S&P 500 profitability by Yardeni Research indicates that corporate profit margins in this cycle may have peaked and begun declining.  A legitimate question is just what level profit margins would normalize to in the event of such a decline, given that the recent peak is higher than at any time in the post-war era.

Source: Yardeni.com

Source: Yardeni.com

The strong employment growth in June was driven entirely by part-time jobs; the economy actually lost 523,000 full-time jobs in the past month, indicating either that employers lack confidence, or that structural changes in the economy (such as increased benefits cost) may have longer lasting effects.  Although the rate of new home sales in the first five months of 2014 was nearly equal to that of 2013, new mortgage originations have been falling steadily since 30-year mortgage rates began rising in mid-2013.  In April 2014, originations reached their lowest point in 14 years, indicating that more homes sold today are being bought either by individuals using cash, or by institutions.  Finally, there is concern that China’s ongoing real estate decline – a 5.3% year-on-year fall in June following much steeper declines in each of April and May – will cause a slowdown in the broader Chinese economy and will possibly drag down growth across Asia. 

Regardless of the direction the economy takes, there are signs that financial markets may be in a period of unsustainable low volatility.  In 2013, corporate share buybacks reached their second highest level ever - $598B, versus the all-time peak in 2007 of $729B.  Jeffrey Kleintop, Chief Market Strategist of LPL Financial, estimates that these buybacks were responsible for half of the S&P 500’s EPS growth in the first quarter of 2014.  The rate of buybacks appears to be slowing - according to TrimTabs Investment Research, announced buybacks by all listed companies fell to their lowest level in two years in the second quarter of 2014.  The first half of 2014 was among the most active six-month periods in history for IPOs, behind only the first half of 2000.  As of the end of June 2014, the S&P 500 had gone 59 trading days without a 1% daily move in either direction, the longest such streak in 19 years (the streak was just broken as we finalized this note).  Mark Hulbert, writing in the Wall Street Journal, reported that US equities are more expensive now - on the basis of price / sales, price / earnings, and price / book – than at 85% of the 35 bull market peaks that have occurred in the past 114 years. High yield bond spreads versus treasuries are currently at their lowest point ever – even lower than before the financial crisis.  In the three months ended May 2014, the 10-year treasury yield fluctuated by no more than 20 bps, the narrowest three-month range in the past 35 years.  Finally, central bankers themselves have become more outspoken about the imbalances created by ongoing monetary stimulus.  William Dudley, Vice Chairman of the FOMC and President of the New York Fed, said the following in May: “Volatility in the markets is unusually low.  I am a little bit nervous that people are taking too much comfort in this low-volatility period.  As a consequence, they’ll take more risk than really what’s appropriate.”

In short, we believe our Mariner and Navigator strategies will continue to prove useful in protecting and growing your assets as markets adjust to the post-QE environment.

Huygens tactical investing strategies design philosophy

At the end of this month, the taper of the Federal Reserve’s QE3 program is expected to reach the halfway point, with its completion targeted for later this year.  Q1 2014 gave us a first glimpse of a return to more normal equity market volatility in response to the taper, with a 7%+ drawdown in the Russell 2000 in each of February and March.  Drawdowns of this magnitude are quite common during rising markets; however these recent drawdowns may have felt unsettling because they are steeper than anything experienced in all of 2013.  Although it may be tempting to conclude that recent volatility is an indicator of further selling to come, in fact data do not support that conclusion.

R2K return vs vol chart.png

The Huygens tactical investing strategies – a brief overview

With this in mind, we believe it would be beneficial to review for you the behavioral finance motivation behind our products, and their design objectives and intended benefits.The below chart (published in the New York Times, March 9, 2013) illustrates that mutual fund investors do not realize anywhere close to the returns of equity indices.The analysis reveals timing as the cause for the disparity – holders of mutual funds as a group make poorly timed decisions to add to or reduce their equity investments.The phenomenon has been widely reported in behavioral finance research, and it arises from two biases in human judgment: first, the tendency of individual investors to fear loss more than to appreciate the opportunity for gain, and second, recency bias, which is an overweighting of recent experience in investors’ decision making.

Analysis source: Dalbar; chart source: New York Times

Analysis source: Dalbar; chart source: New York Times

Jack Schwager, author of the highly regarded Market Wizards series of investing books, recently released the Little Book of Market Wizards.  He devotes an entire chapter to downside risk protection, the common trait he has observed among all of the successful investors he has profiled over the years.  Downside risk protection can provide enormous benefits in the form of reduced volatility and higher long-term investment returns. Our Navigator decision engine is at the core of all of our products, and its objective is to take human impulses - and errors - out of the risk management decision process.  It is designed to participate in rising equity markets while dynamically and systematically hedging against downside risk.

Our research, and past Navigator performance during high volatility periods in 2011 and 2012, have shown that the conditions likely to lead to steep selloffs in U.S. equities can be recognized early in the selloff, in advance of the periods of highest volatility.These predictions are reliable enough that, over time, the benefit of tactically adjusting exposure to equities in response significantly outweighs the cost of potential mistakes.Smaller selloffs and the conditions that lead to them are not so easily predicted, and for that reason our system is designed to “stay the course” during such events, such as those of the past quarter.

The Navigator decision engine is designed to identify “regime changes” in institutional equity investor sentiment.  These investors control the majority of capital invested in equity markets, therefore their collective behavior generally determines the prices at which stocks trade.  They are also generally limited in their ability to quickly reduce their equity exposure in response to perceived risks: either their portfolio size is such that unwinding exposure would require days or weeks to effect, or their investment mandate explicitly requires them to remain fully invested.

Many of them, however, have the ability to use hedging instruments, such as S&P 500 index put options, to limit their downside risk when they feel it is appropriate.  The price they are willing to pay for this protection reveals their current sentiment to the outside world.  We exploit these managers’ sentiment changes as they: 1) rotate out of economically sensitive (or “high beta”) stocks and into defensive stocks; 2) become unwilling to deploy new incoming capital into stocks.  When this happens en masse during a stock market volatility event, it drives up the price of downside hedges and causes high beta stocks to significantly underperform defensive stocks.  Conversely, when their sentiment turns positive, the price of downside hedges falls while high beta stocks outperform.  Negative sentiment regimes can last for several weeks, while positive sentiment regimes can last for months or even years.

Our system consists of a focused set of factors designed to recognize certain long-term patterns in the prices of S&P 500 index options that are indicative of current institutional investor sentiment. We then take on either positive or negative exposure to beta with a long or short position in the Russell 2000 index, using either the IWM ETF or the TF futures contract.We use the Russell 2000 index because it has higher beta than any other equity index, and is therefore more sensitive to such sentiment changes. IWM and TF have the added benefit of being two of the most liquid and easily traded equity index instruments, giving our strategies significant capacity and low trade execution cost.

Mixed economic signals amid ongoing US Central Bank monetary stimulus

Outlook for 2014

We don’t exercise discretion over the day-to-day investment decisions made by our Navigator engine, which incorporates all of our views of how best to position assets in differing market environments. However we do see value in occasionally pointing out to our clients notable macroeconomic conditions that we believe could portend a future change in market sentiment.  Today we are in truly uncharted waters.  Never before have equities experienced the sustained liquidity currently being injected into asset markets by the Federal Reserve.  And although the QE1 taper that concluded in April 2010 was similar to the current QE3 taper, it occurred during a very different market environment in which equity valuations were generally much cheaper than today’s.

Borrowing Donald Rumsfeld’s notorious framework, equity markets are very good at quickly pricing the known knowns.  They often anticipate the possible range of outcomes from known unknowns.  It is the unkown unknowns that cause the most significant and persistent volatility.  With that in mind we offer for your consideration some interesting data points, both bullish and bearish, for equities and for the economy.

Positive signs 

  • In the minutes of its Oct 29th meeting, the Federal Reserve Board of Governors indicated it is likely to reduce the interest rate it pays on banks’ $2.5 trillion of excess reserves held at the central bank.  Reducing this rate gives banks the incentive to put the money to work elsewhere, such as by lending it.  This would be a much more powerful stimulant to the economy than quantitative easing.

  • Many confidence indicators rose steadily after the resolution of the government shutdown, including the Gallup Economic Confidence Index and the Conference Board’s Consumer Confidence Survey

  • In Q4 2013, The ISM’s Purchasing Managers’ Index rose to 56.2, the highest level since April 2011 and a co-incident indicator of economic expansion.

  • Several Federal Reserve measures of the economy indicate a benign environment that should be conducive to growth:

    • In 2013, Real Private Nonresidential Fixed Investment, a measure of business capital expenditures, exceeded levels last seen in 2008.

    • The Chicago Fed National Activity Index, a broad measure of the economy moved further into positive territory. This is generally indicative of accelerating economic growth.

    • The St. Louis Fed Financial Stress Index has returned to levels last seen in the mid-2000’s.

  • Also in Q4, we learned that U.S. home prices grew at their fastest rate in seven years, not seen since 2006, but with home prices on average still 17% below their 2006 peak. Rising home prices can contribute to the wealth effect and lead to increased consumer spending. 

  • The consumer price index rose at a very low 0.3% annualized rate in December 2013, indicating that inflation pressures are not rising and therefore not threatening to interrupt the Federal Reserve’s accommodative Zero Interest Rate Policy. In November, the New York Times reported that similar low inflation rates prevail in the Eurozone as well.

  • Fund flows into U.S. stock mutual funds and ETFs turned positive in 2013 for the first time since the financial crisis.  Fund inflows reached $76 billion in 2013, after fund outflows had peaked at $451 billion post-crisis.

Warning signals

  • According to Thomson Reuters, the Q4 2013 negative pre-announcement ratio is the highest on record.  As of January 3rd 2014, 108 U.S. companies made negative pre-announcements, while 11 were positive.  This continues a trend of higher than normal negative pre-announcements seen throughout 2013.  To date this trend has not had a negative impact on U.S. equities.

  • Cisco’s final 2013 earnings call projected a surprising 8-10% revenue decline in 2014, due to a broad drop in orders from many emerging markets. CEO John Chambers said he’d never seen such a broad and deep decline before.  While this phenomenon could be isolated to Cisco, Chambers said later on the call, “Most of my CEO counterparts can almost finish my sentences in terms of what’s occurring.” 

  • The National Association of Realtors reports existing home sales declined in every month since July 2013, after rising earlier in the year.  This coincides with the mid-year increase in mortgage interest rates.  The NAR’s chief economist predicts the 30-year mortgage rate will rise to 5.5% by year-end 2014, from 3.5% in H1 2013.

  • In the past several months, the Chinese central government has wrestled to control shadow bank lending by increasing interbank interest rates.  According to Fitch Ratings, China’s domestic debt has risen to 216% of GDP, up from 128% in 2008.  Two separate liquidity crises have resulted – one in June 2013 and another this month – requiring emergency government infusions of liquidity.

  • At the end of 2013, the Investors’ Intelligence weekly survey of investment advisors recorded its most bullish reading since 1987 – more than 4 bulls to every bear.  Such strongly bullish sentiment is generally considered a contrarian indicator, since it implies there are few investors remaining to enter the market.

  • Three prominent investors – Walt’s former colleague Byron Wien, Vice Chairman of Blackstone Advisory Partners, Bill Gross of Pimco, and Ray Dalio of Bridgewater - have all attributed 2013’s stock market performance primarily to central bank liquidity.  Gross, in his December investment outlook, was particularly strident in his characterization of the policy: Many asset classes today “contain artificially priced assets based on artificially low interest rates… Investors are all playing the same dangerous game that depends on a near perpetual policy of cheap financing.” 

Regardless of whether markets are more or less volatile in 2014 than in 2013, we remain committed to protecting and growing your assets.

U.S. stock market's pace of gains not likely to continue after Central Bank monetary stimulus ends

The very strong equity market gains and low volatility in Q3 made it a quarter in which few hedging strategies of any sort could demonstrate their benefits, continuing the trend that began in Q4 2012 with the latest round of quantitative easing(QE).  As you know, we have studied the recent periods of QE in depth and have assessed their impact on U.S. equity market dynamics and on our strategies.  We thought it important to share with you some of the evidence of this impact.  Our view is that Federal Reserve Bank (FRB) liquidity has been a major driver of stock market gains since 2009, and it has dampened volatility to a level not consistent with long run stock market behavior.  It has also altered the relationship between volatility and returns.  We believe this effect is temporary and that more typical levels of volatility will return with the advent of the FRB’s eventual taper. In the meantime, this quarter we have enhanced our Navigator and Mariner strategies to minimize the negative impact of QE on their performance.  Finally, we make the case in this note that stocks are not likely to continue their blistering pace of 2013, and that they could experience a meaningful correction once the taper is underway.

QE Chart.png

First, consider the chart above.  The green line is the ‘Securities held outright’ portion of the FRB’s balance sheet (left axis), which represents the cumulative dollar value of easing, and the purple line is the S&P 500 index (right axis).  Cumulative asset flows into domestic equities via ETFs and mutual funds (blue and red lines respectively) have been negative since January 2008 and are therefore unlikely to have been the driver behind stocks’ gains during this time. However, returns in U.S. equities correlate remarkably with the FRB’s three QE programs. The mechanism by which QE drives positive returns across asset classes, particularly equities, is called the “Portfolio Balance Channel,” and was described by Ben Bernanke in his 2012 Jackson Hole speech:

“Federal Reserve purchases of mortgage-backed securities (MBS), for example, should raise the prices and lower the yields of those securities; moreover, as investors rebalance their portfolios by replacing the MBS sold to the Federal  Reserve with other assets, the prices of the assets they buy should rise and their yields decline as well.  Declining yields and rising asset prices ease overall financial conditions and stimulate economic activity through channels similar to those for conventional monetary policy.”

Returning to the above chart, notice that since the S&P 500 bottomed in March 2009, the two steepest corrections have occurred coincident with termination of previous FRB easing programs.  Significant negative economic news contributed to these corrections -  the emergence of the Eurozone debt crisis in April 2010, and the U.S. credit rating downgrade in July 2011.   However, we believe that the termination of FRB easing was a significant contributor, and that the upcoming taper of QE3 will be accompanied by a similar equities correction. 

Second, QE has had significant impact on stock market volatility. Each of the three QE programs caused volatility (as measured by the standard deviation of S&P 500 daily returns) to fall by more than a third relative to the non-QE period preceding it, while simultaneously causing average daily returns to increase significantly. In fact, both QE2 and QE3 caused volatility of daily returns to fall below 0.80%, well below the pre-crisis level of 1.00% (measured from 1990 through 2007).

The following chart demonstrates that QE has also altered the relationship between volatility and realized returns.

Volatility deciles.png

We sorted every two-week period from Jan 1990 through Sep 2013 into deciles by volatility of daily returns, and then plotted the median daily returns of each decile.  The blue bars represent all periods occurring outside of QE programs; the red bars represent all periods occurring during QE programs. The non-QE periods (blue bars) show a relationship that one would  expect - average realized returns are worst, and negative, in the most volatile periods. In fact, this relationship between volatility and returns is a key attribute that our system exploits - it is designed to position our clients defensively during  periods of market stress, therefore capitalizing on these negative returns.  The red bars show something very surprising - when QE is in effect, the highest volatility periods result in strongly positive returns.  It is this unexpected impact of QE that we referred to in our last quarterly note as ‘a temporary repeal of market forces.’

Current economic environment

We do not make investment decisions based on our assessment of macroeconomic conditions.  However, we do follow them closely.  At certain times we think it useful to review conditions for our clients and to offer our opinion of what the future holds for equities and for our strategies. Despite the strong stock market performance throughout 2013, underlying economic performance this year has been mixed, and we believe stocks are becoming overvalued as a result of ongoing QE.  Our view is that, with profit margins at historic highs, revenue growth virtually flat in 2013, and S&P 500 P/E multiples at levels normally  seen only in periods of simultaneous strong economic growth and falling interest rates, stocks are vulnerable to a correction.

July economic data were mixed.  Positive data included a return of U.S. automakers’ sales to pre-crisis levels, and a healthy 56 reading for the services PMI index.  However other data made it clear that the economy was still struggling.  As the second quarter earnings season got underway, the negative pre-announcement ratio of 6.5 (6.5 negative pre-announcements for  each positive one in the S&P 500) was the worst it has been since Q1 2001.  New home sales fell 13.4% in July and June new home sales were revised down steeply. New job creation was weak at 162,000 jobs; unemployment fell to 7.4%, driven mainly by declining workforce participation.

In early September, a wealth of economic releases suggested the economy was continuing to improve at a slow pace, but without benefit to employment.   Personal incomes grew at their fastest pace in six  months, consumer spending increased, and both the services and manufacturing PMI indices rose to new highs. Once again, unemployment declined slightly due to a further shrinking workforce.  Later in September, the FRB announced that it would not yet begin to taper QE3, and it reduced by 0.3% its projection of U.S. GDP growth in both 2013 and 2014.

Mark Hulbert, editor of the Hulbert Financial Digest and a frequent investing columnist for Barron’s and the New York Times, has produced two separate assessments of current stock market conditions and the potential for a correction.  In a July 2013 analysis of P/E ratios using Robert Shiller’s (this year’s Nobel laureate) database of historical domestic equity returns, Hulbert  determined that trailing P/E ratios have averaged 17.5 during secular downtrends in long term interest rates, and 12.8 during  uptrends.  The implication is that, with a secular uptrend in rates likely to commence concurrent with the FRB’s QE taper, stocks could correct quickly to a lower multiple.

In a Barron’s article that same month, Hulbert compared the current bull market to 35 bull market tops dating back to the 1920s. He found some important similarities to today’s market:

  • The average bull market has gained more than 21% over the 12 months prior to a top, versus the S&P 500’s 23% annual return as of July

  • Trailing P/Es at bull market tops average to 18.7, vs. the S&P 500’s July reading of 17.9

  • Low price/book (P/B) stocks outperform high P/B stocks in the 12 months preceding the top by an average of 2:1. As of July, this outperformance for the S&P 500 was closer to 3:1.

Finally, we point out a valuation metric reportedly favored by Warren Buffett, the ratio of total U.S. market cap to U.S. GDP  (see below chart, from Vectorgrader.com, comparing this metric to the S&P 500).  

Analysis and graphic courtesy of Vectorgrader.com

Analysis and graphic courtesy of Vectorgrader.com

Past peaks in the ratio have coincided with  4 the onset of bear markets.  This ratio is currently exceeding its second highest peak period since 1950, surpassed only by its  level achieved in the technology bubble.  We see this as an indication that U.S. stocks are richly valued, although we recognize  that the growing importance of international revenue to S&P 500 companies may also be contributing to this elevated level.

In sum, we believe that ongoing FRB liquidity is distorting equity market behavior and valuations in meaningful ways.  Our  strategies, and the protections they aim to provide, continue to be an important part of an investor’s portfolio.

U.S. Federal Reserve causes temporary repeal of market forces with unprecedented monetary stimulus

Once again this quarter, the primary macroeconomic story affecting nearly every asset class has been the liquidity provided by central banks around the globe. From March 1st to May 22nd, just the Federal Reserve’s balance sheet alone increased by $285 billion. Many market analysts, such as Bianco Research in the figure below, have concluded that stocks’ positive returns in 2013 (and in recent years as well) have been greatly influenced by this liquidity.

Analysis and image courtesy Bianco Research

Analysis and image courtesy Bianco Research

Meaningful fundamental earnings data did not seem to have a significant impact on stock market volatility or direction in the first half of 2013.  Q1 earnings reports and Q2 earnings pre-announcements both indicated that S&P 500 companies are generally struggling to grow revenues.  According to Thomson Reuters, as of May 1st, 43% of S&P 500 companies had reported beating analysts’ Q1 revenue expectations, much less than the typical 63%.  In addition, as of June 28th, the Q2 ratio of negative to positive earnings pre-announcements was 6.5, which is the worst pre-announcement ratio since Q1 of 2001.  Meanwhile, U.S. equity market margin debt rose in late Q1 to levels equal to those reached at the previous market peak in mid-2007, meaning that a significant amount of leverage is contributing to stock valuations. 

Despite this potentially dangerous combination of negative news and high leverage, the events that really moved stocks the most in H1 2013 were FOMC minutes and public statements by the Federal Reserve Chairman.  In the two weeks preceding the Feb 20th release, the standard deviation of daily S&P 500 returns was 0.5%; in the week following the release, it rose to 1.3%.  This realized volatility vanished as quickly as it appeared – in the ensuing two weeks, it fell again to 0.3%.  The same pattern occurred again following the April 10th release.

In this light, the past two quarters (and perhaps more) of strong stock market performance could be viewed as a temporary repeal of conventional market forces.Because of the brief duration and limited severity of realized volatility events over the past 12 months, there have been few episodes of market stress that our strategies are designed to both protect against and profit from.Nonetheless, our strategies have continued to perform as designed, and, we believe, continue to serve as valuable protection against the downside risks that equity markets face.