Huygens Active U.S. Stocks Portfolio
Did you predict that U.S. stocks would recover in the second half of 2022?
Did you predict that U.S. stocks would sell off in February 2020, and then recover in April 2020?
Did you predict U.S. stocks would perform strongly right after the 2016 presidential election?
The Huygens U.S. Stock Market Stress Indicator did.
Most investors react to volatile markets by moving their money to the sidelines, then waiting “until things settle down” to get back in. The hardest thing about a market selloff isn’t knowing when to get out - it’s knowing when to get back in, and most investors wait too long.
If you or your investment advisor missed strong U.S. stock market rebounds such as April & May of 2020 or July of 2022, consider investing with the Huygens Active U.S. Stocks Portfolio. Its active quantitative downside risk management, powered by the Huygens U.S. Stock Market Stress Indicator, is designed to give you comfort during periods of market stress so that you stay invested and capture returns when markets rebound.
Huygens’s U.S. Stock Market Stress Indicator positions your portfolio either bearishly to protect against risk, or bullishly to capture stock market gains.

Bull market positioning
In bull markets, the portfolio uses smart beta indices to favor stocks with strong price momentum and low price volatility, and adds government bonds exposure to cushion unforeseen volatility. The bullish portfolio consists of:
Bear market positioning
In bear markets, the portfolio replaces the momentum stocks, which can be more volatile, with 10-year treasuries to protect against steep losses. The rest of the portfolio remains unchanged. The bearish portfolio consists of:


The above portfolio weights are for our customers that have selected capital preservation as their investment objective. The precise weighting of these ETFs in your portfolio will depend on which objective you’ve selected with our easy-to-use Portfolio Builder: Capital Preservation, Moderate Growth, or Aggressive Growth.
Our U.S. Stock Market Stress Indicator in action:
A snapshot of Huygens Active U.S. Stocks Portfolio performance*
August 2018 through July 2020
Over two significant periods of U.S. Stock Market volatility in 2018 through 2020, Huygens’s Active U.S. Stocks Portfolios significantly outperformed the U.S. equity market index* by positioning bearishly in periods of high volatility and avoiding portions of the ensuing steep selloffs, then repositioning bullishly in the early phases of recovery.

*Capital Preservation Huygens Active U.S. Stocks Portfolio shown. See complete performance histories and further notes & disclosures below. Past performance is not necessarily indicative of future results.
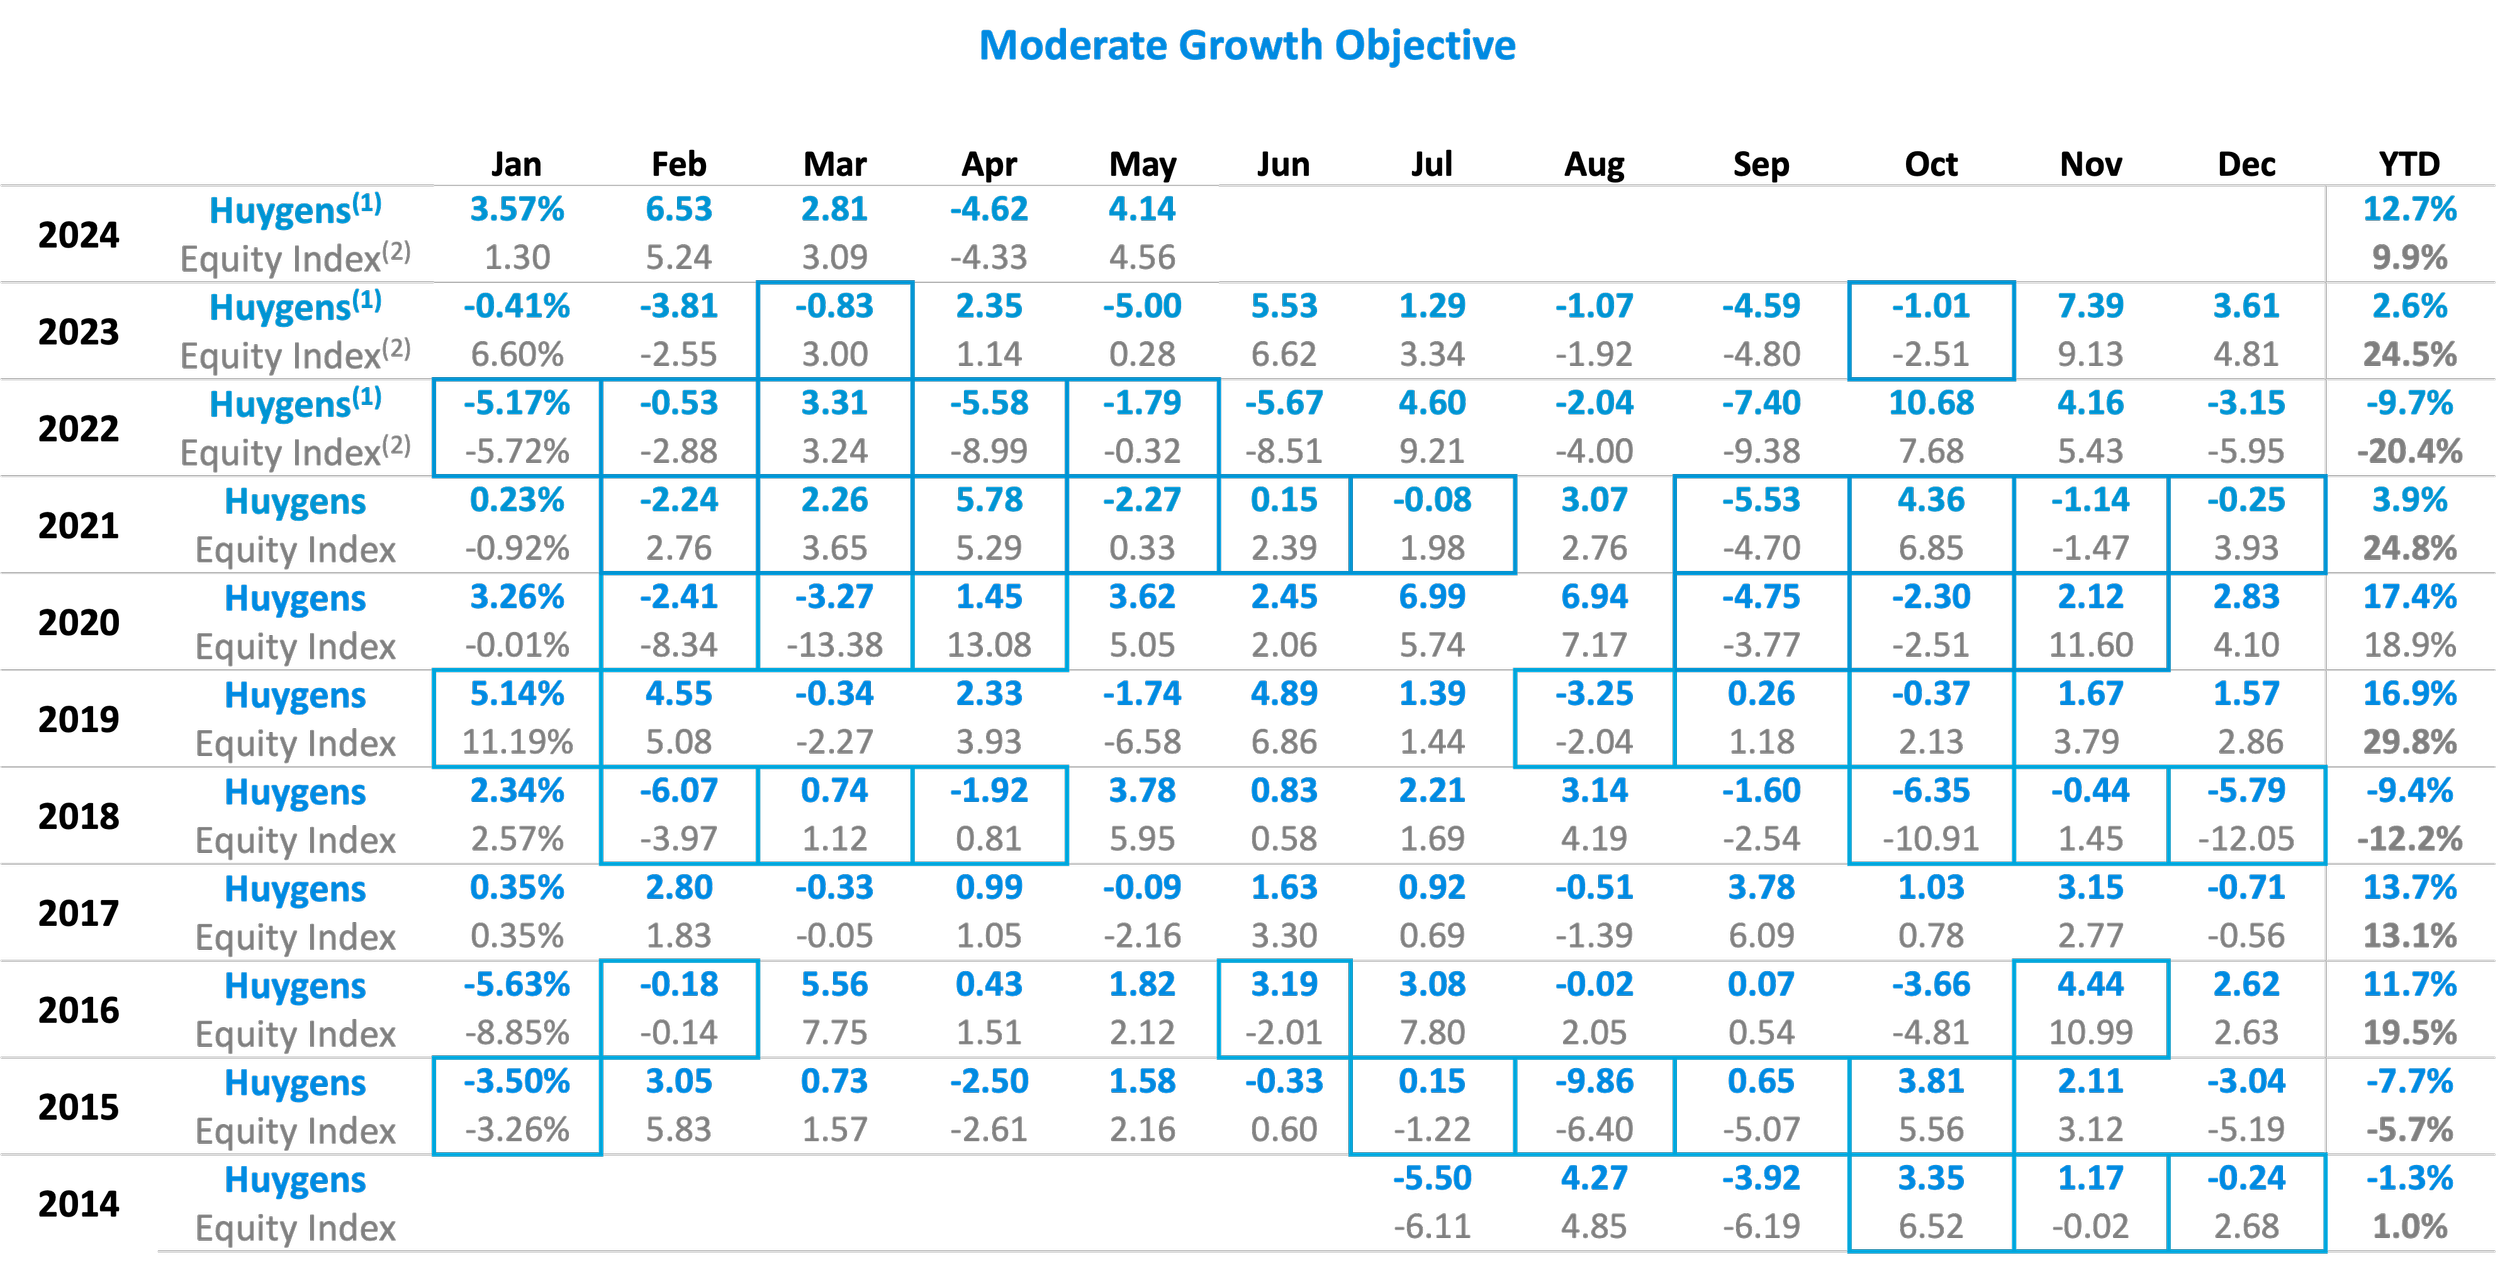
Huygens Active U.S. Stocks Portfolio monthly performance* since inception
July 2014 - May 2024
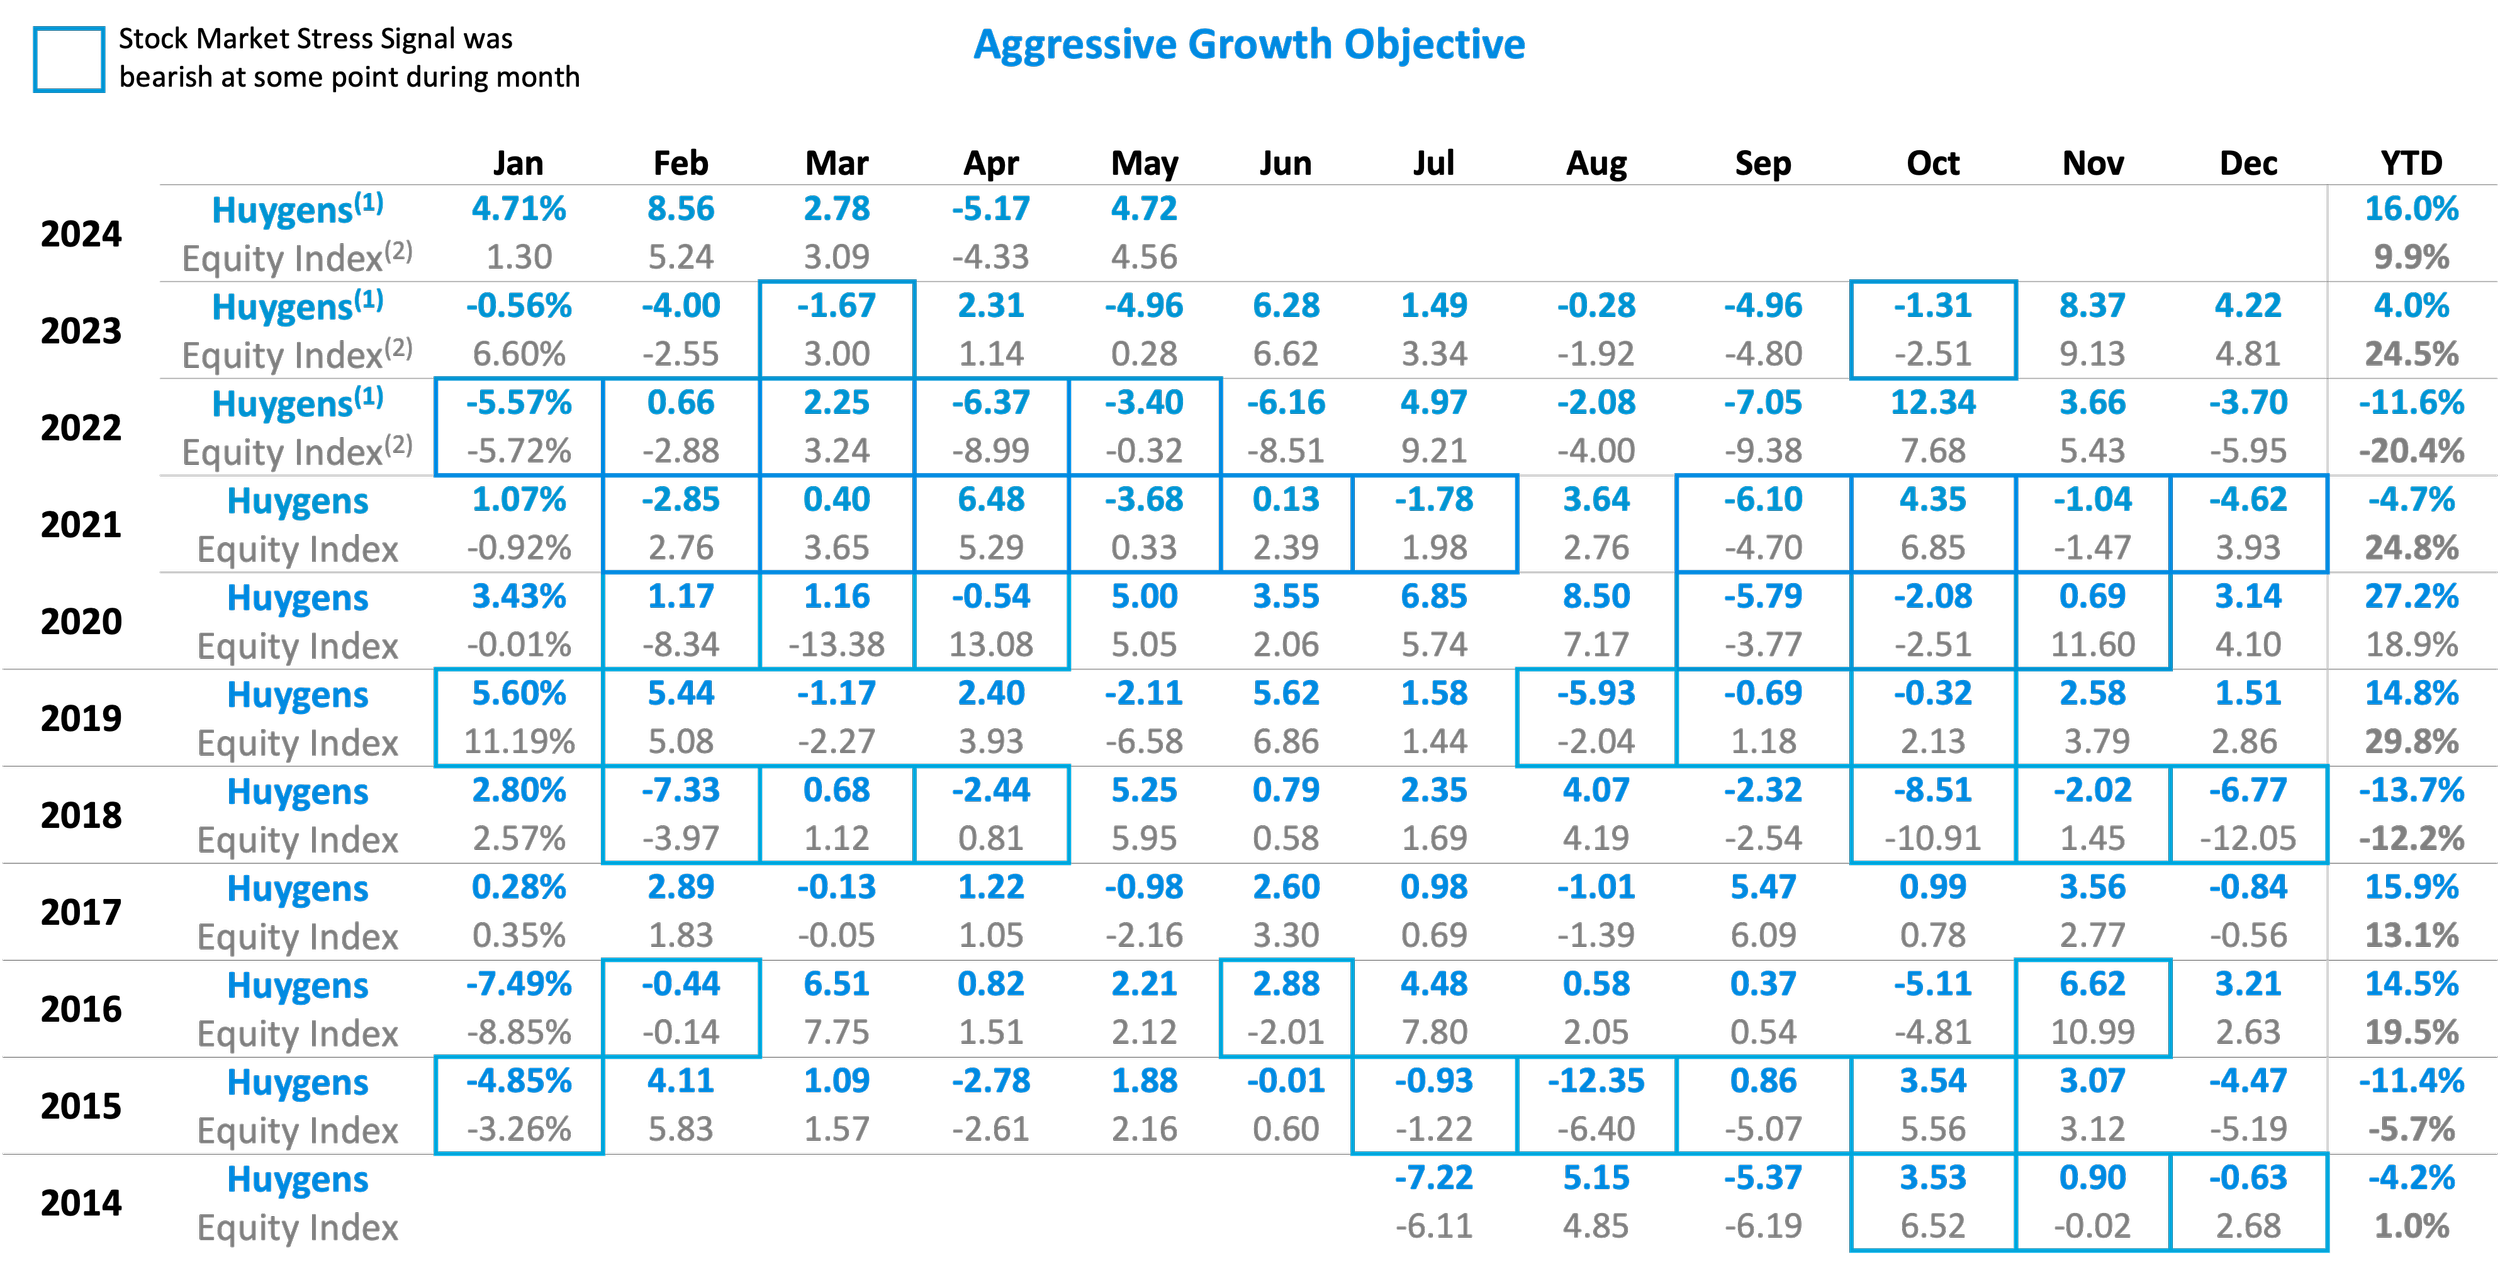
*Past performance is not necessarily indicative of future results
*Past performance is not necessarily indicative of future results

*Past performance is not necessarily indicative of future results
*Important notes:
Actual performance shown for these portfolios reflects client account and proprietary account performance, both of which reflect the pro-forma impact of 1.25% management fee
The Huygens Active U.S. Stocks Portfolio’s bull market positioning composition was changed as of April 1st, 2019.
Before this date, the bull market portfolio consisted of IWM (the Russell 2000 small cap index ETF), UWM (the 2x Russell 2000 ETF), SPLV (the low volatility U.S. stock ETF), and IEF (the 10-year U.S. treasury ETF), in proportions that varied based on the investor’s objective (capital preservation, moderate growth, aggressive growth).
After this date, MTUM - the MSCI US Momentum stock index ETF - replaces the portion of the portfolios previously occupied by IWM and UWM. The MSCI US Momentum stock index is a Smart Beta index (read more about that here) that re-selects and weights its constituents every 6 months, starting from a population of all US large and mid-size publicly traded companies. Our rationale for making this change is described in our Aug 3rd 2019 blog post
Therefore, the equity index return shown for comparison is the Russell 2000 small-cap index for the period July 2014 through March 2019, and the Russell 1000 large-cap and mid-cap stock index for all periods after March 2019.