The nearly flat performance of U.S. equity indices and of our Pilot strategies in the first three months of 2016 belie the full story of the quarter. The divergence between the Russell 2000 and the S&P 500, which we first mentioned in our Q4 2015 note, continued and accelerated. The below chart shows the relative change in the equity indices our strategies use versus the S&P 500 over the past two years. During most of this time, the Russell has lagged the S&P 500. The lowest-volatility names of the S&P 500 - generally defensive stocks such as utilities and consumer staples - performed best.
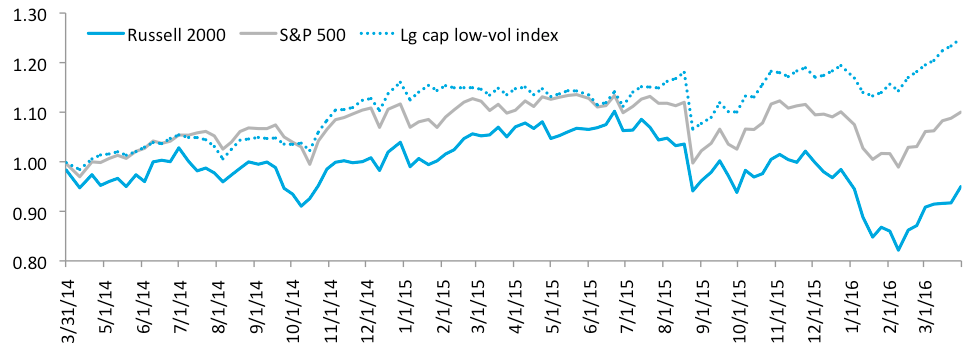
In mid-2015 it appeared the small-cap vs. large-cap performance gap was closing, but instead it widened further, with the Russell underperforming the S&P by 11.0% since June 29, 2015. More than half of that gap occurred in the fraught first six weeks of 2016. We believe the ongoing divergence has been driven by falling oil prices (disproportionately negative for small-caps), and corporate buybacks (disproportionately positive for large caps).

Source: Yardeni.com
The above and following charts, from Yardeni Research, show that energy is having more impact on the small-cap universe than the large-cap. The S&P 600 is a U.S. small-cap index, essentially comprising the 600 largest companies of the Russell 2000 index that we use. The charts show the relative expected earnings contribution of each industry segment to the earnings of the overall index. At the start of 2014, energy was by far the largest contributor to small cap expected earnings, but in 2015 that contribution declined dramatically and turned negative. Energy earnings expectations briefly improved in mid-2015, but then deteriorated further into negative territory through Q1 2016.

Source: Yardeni.com
Energy was also a drag on the S&P 500 large-cap index over this time, however its relative contribution to index earnings wasn’t as large to begin with in 2014, plus large-cap energy companies have managed to keep their earnings positive.
Now consider the Thomson-Reuters U.S. equity mutual fund flow data below. It shows that aside from 2013-14, investor capital has been steadily flowing out of U.S. equities, with the outflow accelerating to an annualized rate of $66B in Q1 2016.

Consider also that, according to the World Bank, U.S. equity market capitalization shrank by 4.8% in 2015, from $26.3 trillion to $25.1. Corporate buybacks, a mainly large-cap phenomenon, help explain what has been supporting the S&P 500 index as market capitalization declined and investor capital flowed out of the market. According to the below Factset Research chart of trailing-twelve-month U.S. buybacks, the annual value of corporate share buybacks has remained near its pre-financial crisis peak, even as earnings have declined. These buybacks simultaneously put upward pressure on equity prices, and return capital to shareholders reducing market capitalization.

Source: FactSet
Projecting these two trends forward, it appears that the worst of the large-cap / small-cap divergence may be over. If S&P 500 earnings don’t rebound from their ongoing decline (light green bars in the above chart), companies may choose to deploy more of their net income into growth projects rather than return it to shareholders through buybacks. Regarding energy, WTI crude oil prices have recently risen 43% since February to $45.92 / bbl, a level not seen since December.
This may not mean that the economy has turned a corner.In fact, the below Yardeni Research chart shows that when S&P 500 revenues have declined for multiple quarters as they have recently, a recession was already underway. Stay tuned.

Source: Yardeni.com