The story of the third quarter is very similar to that of the second quarter. It stands out as an almost uniquely calm period for US equity markets. Consider:
In the 27 years from VIX index inception in 1990 through the second quarter of 2017, the VIX Index closed below 10 on 16 days. In the third quarter of 2017 alone, the VIX Index closed below 10 on 17 additional days. The quarter represents less than 1% of trading days in the past 27 years, but more than half of all sub-10 VIX closes.
The overall VIX Index average for the quarter was 10.94, the lowest in history.
One week in late September saw the S&P 500 move less than 0.5% (intraday peak to intraday trough), the tightest such one-week range since the 1970s
Placid periods for U.S. equity markets generally correlate to positive returns. The chart below plots Russell 2000 quarterly returns against prevailing average VIX levels in the same quarter. The large green data point at the leftmost end of the distribution represents the third quarter of 2017.
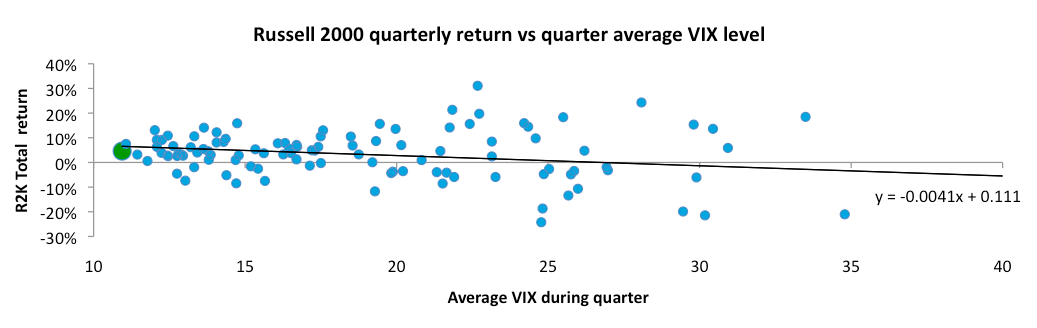
The chart demonstrates that when equity market volatility and implied volatility are this low, returns tend to be quite positive and narrowly distributed around the positive expected outcome. As the average VIX level increases, the expected return falls, and the range of possible returns increases dramatically. Those of you that check our market stress indicator regularly or receive our signal email weekly may have been wondering why it has remained in the offensive state since November of 2016. The above chart hopefully makes the answer clear: with implied volatility this low, it is best to stay the course with equities and maintain full exposure.
Low equity market volatility generally results from positive investor sentiment regarding economic conditions. The third quarter’s abnormally low volatility coincides with, and likely results partially from, an almost equally rare confluence of good employment news (all charts sourced from yardeni.com):
Steady job creation has continued in 2017, with no sign of slowing

Source: Yardeni.com
U-6 unemployment (which measures the unemployed plus those workers that are employed part-time for economic reasons) has returned to its pre-crisis level, indicating most workers displaced in the crisis have now found full-time employment

Source: Yardeni.com
The ratio of job seekers to job openings is at its lowest level of the past 17 years

Source: Yardeni.com
In such an employment environment, workers can be forgiven for feeling relatively safe in their jobs and looking forward to rising wages, as reflected in high Conference Board consumer confidence readings:
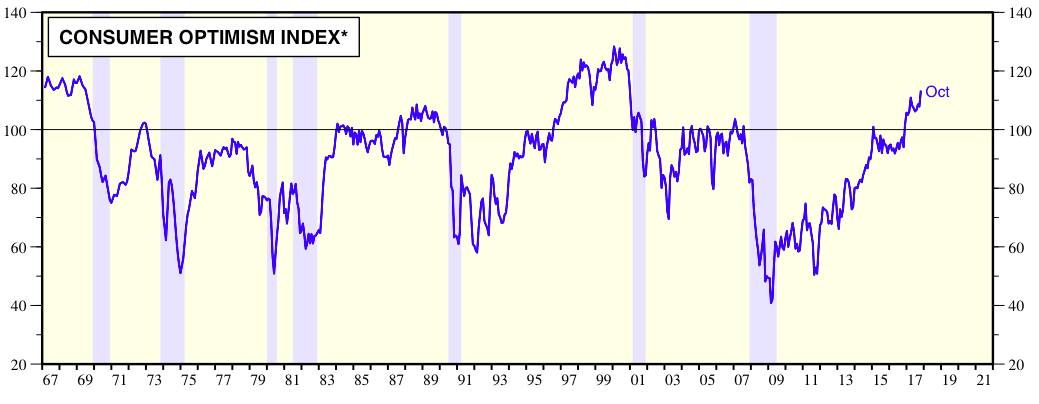
Source: Yardeni.com
In summary, sustained strong improvements in employment have finally overcome the consumer caution that lingered for so long from the financial crisis. These developments seem likely to enhance current positive economic conditions in the near future, and therefore contribute to the ongoing low volatility equity market.