Note: this client note has been edited since it was originally sent to our clients in 2018, in order to clarify language related to our dynamic derivatives portfolios
2017 was the first full year in operation for our dynamic derivatives portfolios, and we are pleased to say that their actual performance was highly similar to the performance for which they were designed:
In 2017 they had bullish positioning (meaning exposure to the short VIX futures ETF position) on 125 of 251 trading days, and were in bearish positioning the rest of the time. This was in line with our hypothetical model, which shows bullish positioning 45% of the time and bearish the remaining 55%
Our derivatives market stress indicator caused execution of 24 individual trades. 18 of these generated positive return, for a 75% batting average, which is somewhat better than our hypothetical model’s 66% winning trade batting average
Our Titan strategy's net annual return of 48.3% in 2017 is in line with our expected average annual return of ~50%, based on hypothetical backtesting
Our Titan dynamic derivatives strategy is designed to offer our clients a way to aggressively speculate in an asset class that is meaningfully different from traditional equities, fixed income, and commodities. The industry term for Titan’s asset class is ‘volatility,’ but to us at Huygens it is more instructive to think of it in terms of insurance. Titan takes advantage of a persistent mis-pricing of U.S. equity market insurance instruments, driven by large institutional equity portfolio managers’ (think Capital Research, Fidelity, AllianceBernstein, Franklin Templeton, in addition to large hedge fund firms) need to hedge their downside risk. Because of the large amount of equity exposure being hedged, it is a particularly difficult pricing anomaly to arbitrage away.
We expect that all of our clients are well aware of the benign equity investment conditions prevalent in 2017, so we won’t discuss them here. Instead we will focus on just the volatility of U.S. equity returns, because this is what drives Titan’s return generation process.
Both implied and realized volatility set new record lows in the US, dating to the creation of the VIX index in 1990.A few brief spikes of implied volatility did occur - on three occasions the VIX index increased more than 30% in a single day, during all of which the Titan strategy was in cash - but overall 2017 was utterly bereft of equity market swings.Below we highlight a few of the specific ways in which 2017 was out of the ordinary.
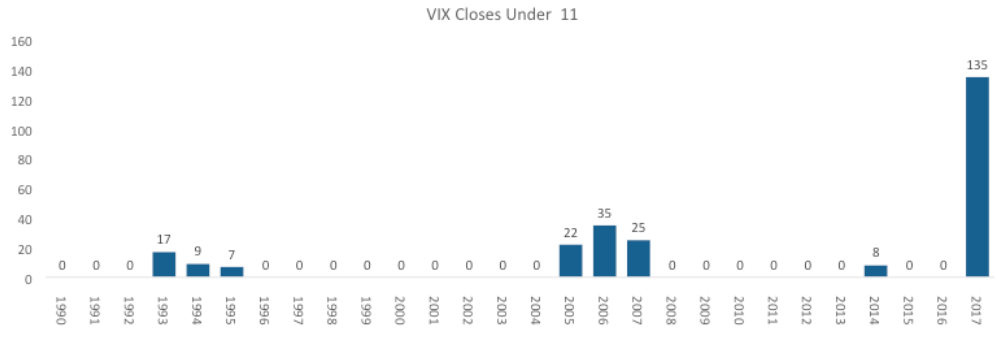
Before 2017, it was rare to see the VIX index close below 11.0. In 2017 this occurred more times than in the prior 26-year history of the VIX Index combined; see chart below. 2017 recorded the lowest ever VIX Index average for a month (October: 10.1), a quarter (3Q: 10.3), and a year (11.1).
Of course the VIX Index measures the price of insurance, as derived from the prices of options that reference the S&P 500 Index. This insurance was so cheap because 2017 was also an extraordinary year for actual realized volatility.
20-day realized volatility - the standard convention when comparing to the VIX index - averaged 6.7 in 2017, dramatically below its average since 1990 of 15.7. Sharp market moves were both small and rare in 2017. In a typical year, the S&P 500 index will suffer a single day decline of more than 1% 30 times and of more than 2% nine times. In 2017 there were four single-day selloffs of more than 1% and no declines greater than 2%. Indeed, the single worst 2-day decline in 2017 was 1.9%. The below chart shows historical levels of both implied and realized volatility, back to 1990:

It should be noted that all of Titan’s 2017 gains were earned in the first quarter. The ultra-low volatility conditions described above really took hold in the second quarter of 2017 and continued through year end, making equity downside insurance extremely cheap. Because of the steep negative response of the VIX to small market perturbations at such low VIX levels, we deem the risk of an ugly reversal and steep losses in such conditions to be too high. As a result our system, after enjoying the conditions of the first quarter, sat out much of the remainder of the year.
Based on past history, the U.S. equity market won’t remain in such a low volatility state permanently. And when volatility returns, our Titan strategy will be ready to capitalize on it for our clients.