Trade war

Latest stock market highs driven by Federal Reserve's return to quantitative easing

You may recall our analysis (click here to read it) demonstrating that nearly all U.S. stock market gains in the decade 2009 - 2018 occurred during periods of Federal Reserve economic stimulus. Have you noticed that since early October stocks have been on a steady march higher, with the U.S. indices all making new record highs? It’s not a coincidence. The Federal Reserve has begun stimulating the economy again, with a new $60B per month liquidity program launched on Oct 2nd but announced a week later (this New York Times article describes it). They’re not calling it “Quantitative Easing,” but mechanically it is the same, with the same impact on the economy and stocks.

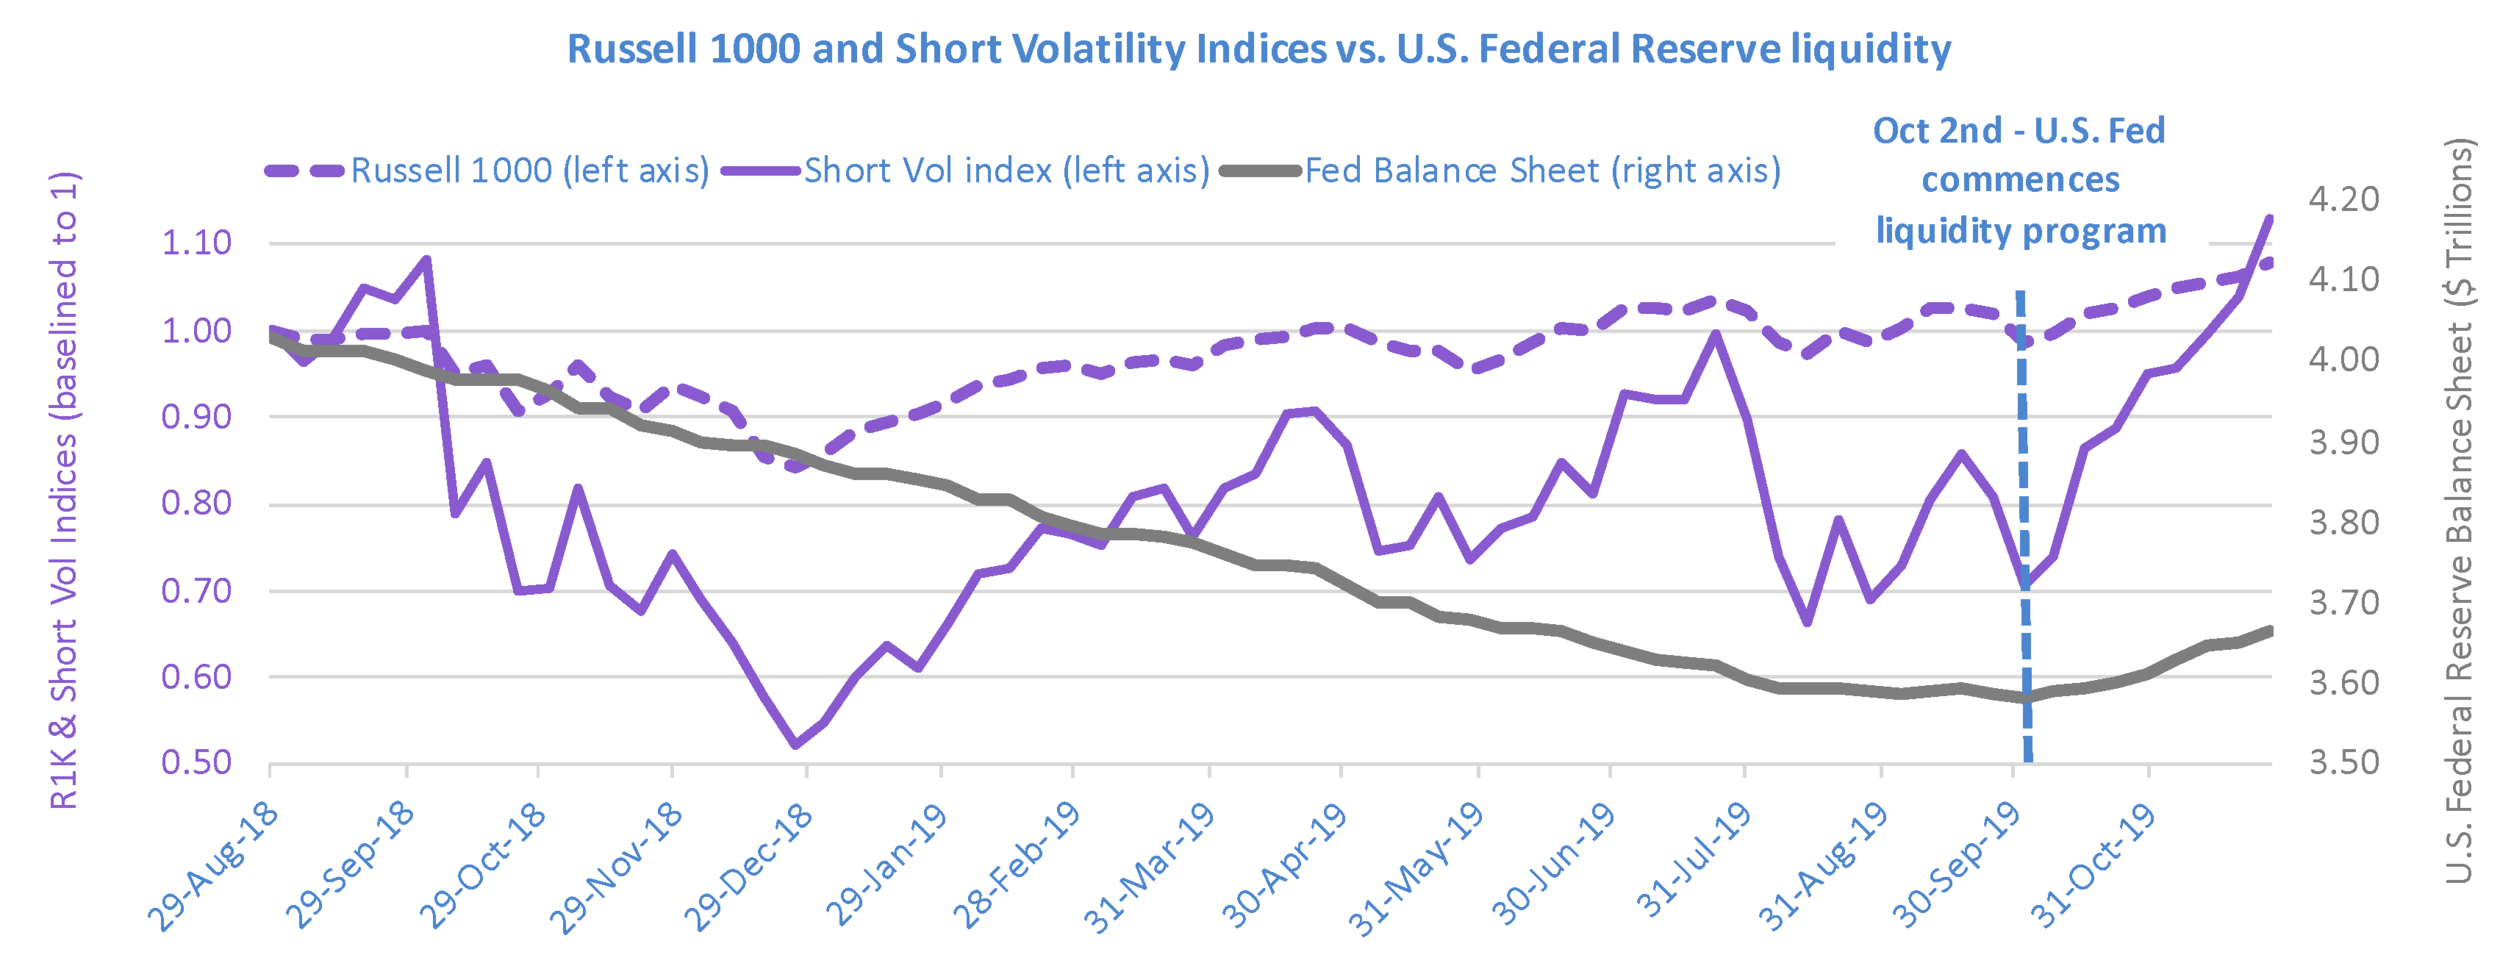
Looking at the chart below, you may be startled to see that despite the very strong run stocks had in 2019 prior to October 2nd, the Russell 1000 stock index was still down 2% from its previous high in August of 2018. Similarly, volatility bursts persisted through 2019, keeping the Short Volatility index from progressing higher. It took this new Fed liquidity to quiet down volatility and enable stocks to push higher.

This program will continue through March of 2020, injecting into the U.S. economy $60 billion or more new liquidity per month. History suggests that investors will benefit.

20191204 Securities held outright vs R1K and Short Vol Index.png

Looking back on our active investment strategies over the past 12 months

The past 12 months have been confusing and likely disappointing for most investors. We’re still in the midst of the longest period in history without a 20%+ S&P 500 drawdown, so it’s natural to worry that another one might be imminent. That underlying anxiety has been reflected in the U.S. equity market’s periodic bursts of volatility since September of last year.

You probably feel some of that anxiety yourself, but don’t have the time or inclination to decide how best to navigate through it. That’s why you’ve hired us. Our active investing portfolios were designed for times like the past year, to give our clients exposure to equities and derivatives and to help them avoid the losses that can result from equity market volatility. Take a look at the below charts to see how we’ve delivered on that mission.

Pilot Cons NAV Past 12 Mo.png

Our active equities portfolios are well ahead of the Russell 1000 and Russell 2000 index to which we compare them (click here for more detail on these indices), as shown in the above chart of our most conservative active equities portfolio.

Titan NAV Past 12 Mo.png
Sidereal NAV Past 12 Mo.png

Our Titan and Sidereal active derivatives strategies are also well ahead of their comparison index, the S&P Short VIX futures index, or simply the Short Volatility Index, which on September 30th was down more than 20% from a year earlier.

Volatility bursts such as those of the past 12 months don’t generally allow for sustainable gains to be earned in equities or in VRP harvesting. That’s why our strategies are designed to identify the bursts as early as possible and wait them out.

China trade war headlines drove a volatile, whiplash August

Our strategies are designed to protect against two types of investment risk:

Headline risk: Same-day stock market response to a news item with implications for equity investors

Economic risk: Longer-term deterioration in economic activity or outlook that can impact equity market fundamentals and investor sentiment

Headline risk arises quickly and can dissipate quickly, while economic risk takes longer to reveal itself clearly and lasts longer with more severe impact. In August, trade-related headline risk emerged on three occasions, and dissipated quickly each time.

Analysts at JP Morgan and BofA noticed this and analyzed the daily market impact of the most prominent source of the headlines, President Trump’s tweets. The bottom line: his Tweets have significant market impact. Read more here: JP Morgan creates index to track Trump tweet impact; Bank of America: On days when Trump tweets a lot, stock market falls

Our investment strategies use portfolio composition designed to protect against headline risk, and use our volatility prediction & market stress indicators to switch to bearish positioning designed to protect when real economic risk emerges.

Because of the magnitude of August’s equity market responses to the trade-related headlines, both of our stress indicators switched to bearish positioning. Our equity market stress indicator switched back to bullish each time the headline risk dissipated; our derivative market stress indicator stayed bearish throughout the month, as shown below.

190916 Derivs indicator vs Short Vol Index.png

The outcome in August for our active derivatives portfolios is that they avoided most of the month’s drawdown and volatility.

Frequent bullish - bearish reversals such as those in August are the most challenging environment for our active equity portfolios. Our Capital Preservation portfolio, which is designed with the most cushion against headline risk, outperformed the Russell 1000 index in August. But our Moderate and Aggressive portfolios, which have less of that protection, underperformed it.